
What Is a Real-Time Analytics Database?

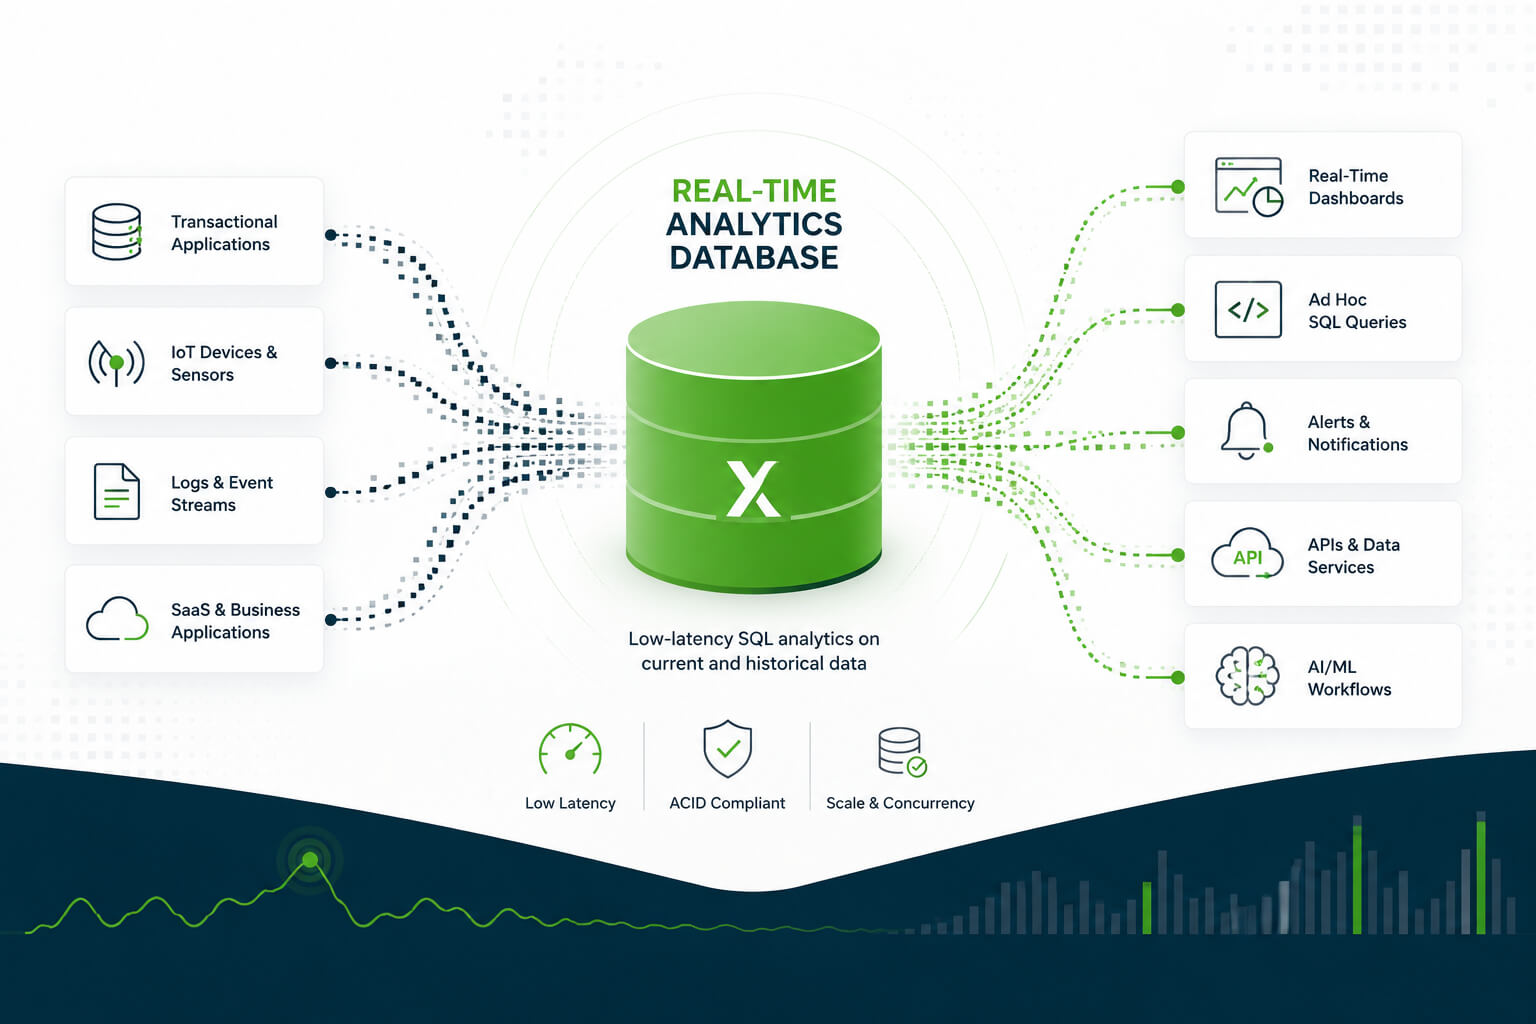
A real-time analytics database ingests new data, makes it available for queries with low latency, and runs analytical SQL across current and historical data. Teams use it when batch reporting is too slow for operational decisions, customer-facing analytics, fraud detection, IoT monitoring, cybersecurity, or AI/ML workloads.
The core requirements are low-latency ingestion, fast analytical queries, high concurrency, and support for complex SQL on changing data. A real-time analytics database also needs to combine recent events with historical context, since most operational decisions depend on both.
This article explains how real-time analytics databases work, how they differ from data warehouses and streaming platforms, and what technical teams should evaluate before choosing one.

Try Exasol Personal for Free
Run real workloads at full Exasol performance.
Role in the Analytics Stack
A real-time analytics database sits between ingestion pipelines and the systems that consume analytical results. It receives new data from streams, applications, logs, operational systems, or change data capture pipelines, then makes that data available through SQL, dashboards, alerts, APIs, and AI/ML workflows. These interactions depend on core database concepts such as storage, querying, data modeling, and controlled access.
Storage is only part of its role. It provides the analytical query layer for data that changes continuously. That layer lets teams aggregate recent events, compare them with historical baselines, and serve results to users or systems under concurrent load.
The database becomes necessary when the data stack needs more than event movement. A streaming platform can transport and process events, but teams still need a queryable analytics layer for historical comparison, ad hoc analysis, and repeated analytical queries.
How it Compares with Related Systems
A real-time analytics database is not the same as a data warehouse, streaming platform, or stream processor. These systems can work together, but each one solves a different part of the architecture.
A data warehouse stores and organizes analytical data for reporting, BI, and governed analysis. It can support near-real-time workloads in some architectures, but data warehouse environments often use batch or scheduled data movement.
A streaming platform moves event data between systems. It helps teams transport, buffer, and distribute events, but teams usually use a separate analytics layer for historical analysis.
A stream processor transforms events while they are in motion. Teams use it to filter, enrich, aggregate, or route data before the data reaches an analytics database or application.
Real-time analytics usually needs both data movement and query access. Streaming tools move data quickly. The real-time analytics database makes current and historical data available for repeated SQL queries, dashboards, alerts, APIs, and downstream decision systems.
When Low-latency Analytics Needs a Dedicated Query Layer
You need a real-time analytics database when analytical results lose value if they arrive after the next batch cycle. The system should support decisions, alerts, dashboards, or application workflows that depend on recent data.
Common triggers include large event volumes, frequent data changes, concurrent users, and queries that combine recent activity with historical records. These workloads usually need more than ingestion speed. They need a query layer that can filter, aggregate, join, and serve results with predictable latency.
A real-time analytics database is less useful when reporting can wait for a scheduled refresh. Batch-oriented reporting may be enough for monthly finance reports, static compliance extracts, or dashboards where yesterday’s data is acceptable.
The technical decision should start with latency, concurrency, query complexity, and retention requirements. If the workload needs current and historical data in the same analytical query, a real-time analytics database becomes a stronger architectural fit.
Reference Architecture
A real-time analytics database works as the queryable layer in a low-latency analytics pipeline. Its role depends on the underlying database architecture: how the system ingests data, stores it for analytical access, plans queries, and serves results to users, applications, dashboards, alerts, or AI/ML workflows.
Don’t benchmark ingestion and query performance separately. For real-time analytical workloads, test them together. A database can return fast results on static data but behave differently when continuous loads, dashboard refreshes, ad hoc SQL, and historical joins run at the same time.
Dirk Beerbohm, Global Partner Solution Architect at Exasol, Exasol
The architecture usually starts with operational systems, event streams, logs, IoT devices, or change data capture pipelines. These sources send data into an ingestion layer, where the pipeline validates, routes, and loads new records into the analytics environment.
Processing can happen before data reaches the database, after loading, or in both places. Teams may clean records, enrich events, calculate derived fields, or aggregate data before query execution. The right pattern depends on latency targets, data quality requirements, and query complexity.
The database layer stores current and historical data in a structure optimized for analytical queries. It must support concurrent reads, continuous writes, complex SQL, and predictable performance under changing workload patterns.
The consumption layer exposes results to BI tools, embedded analytics, APIs, alerting systems, or AI/ML applications. These downstream systems depend on consistent query performance because they often serve operational decisions, not static reports.
A simple architecture looks like this:
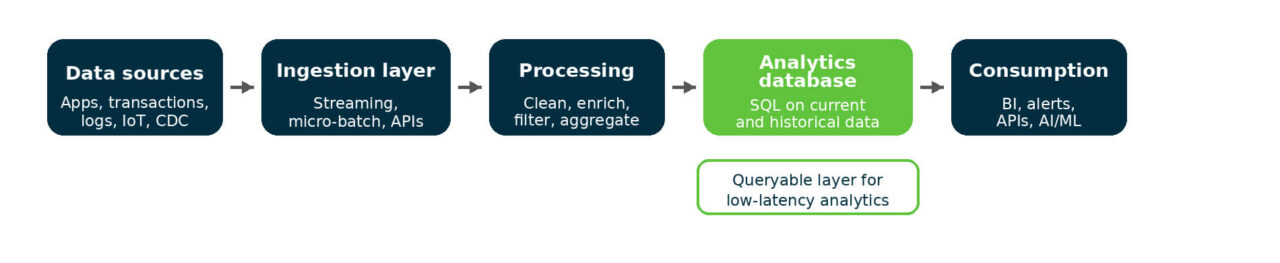
The key design question is where latency can enter the pipeline. Ingestion delay, transformation logic, storage layout, query planning, and concurrency all affect whether the system can support real-time analytics in production.
What to Look for in a Real-time Analytics Database
A real-time analytics database should match the workload, not only the data volume. Start with the latency target, expected concurrency, query patterns, ingestion rate, and retention period.
Fresh data access is usually the first constraint. New records must become available for analysis fast enough to support the decision or workflow. For some teams, that means seconds. For others, a few minutes still meets the operational requirement.
Query performance should include percentiles, not only averages. A database that looks fast in isolated tests may struggle when dashboards, APIs, and analysts run queries at the same time. Evaluate p95 and p99 latency under concurrent load.
SQL depth also matters. Real-time analytics often needs joins, filters, aggregations, window functions, segmentation, and time-based analysis. Limited query support can force teams to move data into another system, which adds latency and operational complexity.
Retention requirements shape the architecture. Some workloads only need recent events. Others need to compare new activity with months or years of historical data. The database should support both without forcing separate query paths.
Data modeling also matters: denormalized data can reduce runtime joins for analytical queries when the workload justifies the added maintenance cost.
The best fit is not always the database with the lowest single-query latency. Technical teams should test the system against the production workload. That includes live ingestion, concurrent queries, realistic data volume, and current plus historical analysis.
Try Exasol Personal for Free
Run real workloads at full Exasol performance.
SQL Query Patterns
SQL is useful in real-time analytics when teams need to analyze changing data without moving it into another query system. Common patterns include recent-event filtering, rolling aggregations, anomaly checks, and joins between new events and historical records.
The SQL examples below show common real-time analytics query patterns. They are written in portable SQL for readability and should be adapted to the SQL dialect, timestamp functions, table schema, and ingestion model used in production.
Recent events by customer segment
SELECT
  c.customer_segment,
  COUNT(*) AS recent_events,
  SUM(e.revenue) AS recent_revenue
FROM events e
JOIN customers c
  ON e.customer_id = c.customer_id
WHERE e.event_time >= CURRENT_TIMESTAMP - INTERVAL '1' HOUR
GROUP BY c.customer_segment;
This query combines recent event data with historical customer attributes. Teams use this pattern for customer behavior analysis, operational dashboards, and revenue monitoring.
Rolling activity check
SELECT
  user_id,
  COUNT(*) AS events_last_5_minutes,
  MAX(event_time) AS latest_event_time
FROM events
WHERE event_time >= CURRENT_TIMESTAMP - INTERVAL '5' MINUTE
GROUP BY user_id;
This pattern checks recent activity by user or entity. It supports alerting, abuse detection, operational monitoring, and product usage analysis.
Anomaly detection on machine data
SELECT
  device_id,
  AVG(metric_value) AS average_metric,
  MAX(metric_value) AS peak_metric
FROM iot_events
WHERE event_time >= CURRENT_TIMESTAMP - INTERVAL '15' MINUTE
GROUP BY device_id
HAVING MAX(metric_value) > AVG(metric_value) * 2;
This query compares each device’s peak metric value with twice its average value in the same time window. Teams use this pattern to detect abnormal device behavior before it affects service quality.
Transaction risk pattern
SELECT
  account_id,
  COUNT(*) AS transaction_count,
  SUM(amount) AS total_amount,
  COUNT(DISTINCT merchant_id) AS merchant_count
FROM transactions
WHERE transaction_time >= CURRENT_TIMESTAMP - INTERVAL '10' MINUTE
GROUP BY account_id
HAVING COUNT(*) > 20
   OR SUM(amount) > 10000
   OR COUNT(DISTINCT merchant_id) > 10;
This pattern flags accounts with unusual recent transaction behavior. It does not replace a risk model, but it can support rule-based monitoring or feature generation for downstream systems.
For production workloads, teams should test these queries with live ingestion, realistic concurrency, and representative historical data. A query that works on recent records alone may behave differently when it joins current events with large dimension tables or long retention periods.
Real-time Analytics Database Use Cases
A real-time analytics database is useful when teams need to query recent data before it loses operational value. The strongest use cases combine live signals with historical context.
Operational dashboards
Operational dashboards track service performance, logistics, inventory, usage, revenue, or SLA metrics while the business is running. These dashboards need more than scheduled reporting when teams use them to respond to incidents or changing demand.
A real-time analytics database supports this pattern by serving current metrics to BI tools or embedded dashboards. It also needs predictable performance when users refresh dashboards at the same time.
In Darmstadt, traffic planners use Exasol to analyze real-time traffic and environmental data for environmentally sensitive traffic management. The platform combines traffic sensor and environmental monitoring data, supports automated analysis, and feeds Tableau dashboards for traffic flows, emissions, and traffic management decisions.
Customer behavior analytics
Customer behavior analytics uses product events, transactions, sessions, clicks, and account data to understand recent user activity. Teams use this data for segmentation, personalization, journey analysis, and revenue monitoring.
The database must support queries that combine recent events with historical customer attributes. Without that context, teams can see activity but struggle to determine whether it is normal, valuable, risky, or unexpected.
Monsoon uses Exasol for retail analytics across order volumes, inventory levels, customer segmentation, and personalized customer experiences. Report runtimes dropped from 18 hours to minutes, and teams gained real-time visibility into order volumes and inventory levels.
IoT and machine data monitoring
IoT and machine data workloads generate continuous sensor, device, or telemetry data. Teams use this data to detect abnormal readings, monitor assets, and identify maintenance needs.
A real-time analytics database helps when analysts or applications need to compare recent readings with thresholds, historical behavior, or device groups. Query performance matters because telemetry workloads can create large event volumes.
WashTec uses Exasol with machine data from connected car wash systems to support predictive maintenance. The data includes sensor readings, wash executions, error messages, machine master data, and historical service records. Dataiku connects to Exasol for access to stored machine data, while complex preprocessing runs in Exasol’s in-memory engine before feature engineering and model development.
Cybersecurity analytics
Cybersecurity analytics depends on logs, identity events, network activity, endpoint signals, and application events. Security teams need to detect suspicious behavior while the threat is active, not after a scheduled batch job completes.
A real-time analytics database can support detection rules, investigation dashboards, and alerting workflows. It should allow teams to filter recent events, join them with historical context, and query across large volumes of security data.
AI/ML workflows
AI/ML workflows often need current data for feature generation, monitoring, recommendations, forecasting, or decision support. Stale data can reduce the value of models that depend on recent behavior.
A real-time analytics database can provide queryable features and context for downstream AI/ML systems. Teams still need model governance, validation, and monitoring. The database supplies fast access to the analytical data those systems use. NIST’s AI Risk Management Framework provides a useful reference for managing AI-related risks across systems and organizations.
Fraud detection
Fraud detection depends on recent transaction behavior, account history, location patterns, merchant data, and device signals. A real-time analytics database can support rules, alerts, and model features that compare current activity with known baselines.
For example, a risk team might monitor accounts with unusual transaction volume in the last 10 minutes. The database needs to query recent transactions, join them with account attributes, and return results fast enough for downstream review or automated action.
Try Exasol Personal for Free
Run real workloads at full Exasol performance.
Database vs. Data Warehouse
A real-time analytics database and a data warehouse both support analytical workloads. The difference is the latency, query pattern, and operational role they are designed to support.
A data warehouse often acts as the central analytical layer for governed analytics, reporting, and historical analysis. It works well when teams need consistent business metrics, integrated data models, and scheduled reporting cycles. This distinction builds on the broader data warehouse vs database comparison: operational databases record current activity, while data warehouses help teams analyze patterns over time.
A real-time analytics database is a better fit when teams need to query recent data while it is still operationally useful. It supports dashboards, alerts, applications, and decision workflows that depend on current data plus historical context.
The systems can also work together. A data warehouse can remain the governed analytical store, while a real-time analytics database serves workloads that need lower latency, specific concurrency targets, or faster access to changing data.
| Dimension | Data warehouse | Real-time analytics database |
|---|---|---|
| Primary role | Governed analytics and reporting | Low-latency analytical query serving |
| Data freshness | Often scheduled or batch-based | Designed for recent data access |
| Common users | Analysts, finance teams, BI teams | Analysts, applications, operations teams, data products |
| Query pattern | Reporting, historical analysis, business metrics | Dashboards, alerts, embedded analytics, operational decisions |
| Performance requirement | Consistent reporting performance | Predictable latency under concurrent load |
| Historical context | Primary design goal | Required for comparing recent events with past behavior |
| Operational fit | Periodic analysis and governed reporting | Time-sensitive analysis and application-facing workloads |
A real-time analytics database does not replace the data warehouse by default. The better architectural question is which workloads need governed reporting, which workloads need low-latency query access, and where the same data needs to serve both.
Real-time Analytics Database Vs. Streaming Analytics
A real-time analytics database and streaming analytics both work with recent data. They solve different problems in the data pipeline.
Streaming analytics processes events while they move through the pipeline. Teams use it to filter, enrich, aggregate, route, or detect patterns in data streams before the data reaches another system.
A real-time analytics database stores current and historical data for analytical queries. Teams use it when they need SQL access, repeated analysis, dashboards, alerts, or application-facing results based on recent and historical records.
The distinction matters when a workload needs context. A streaming job can detect a pattern in a live event stream, but operational decisions often need historical account data, customer attributes, device baselines, or previous behavior.
In practice, teams often use both systems. Streaming analytics prepares or transforms data in motion. The real-time analytics database makes that data queryable for analysts, applications, BI tools, and downstream workflows.
A streaming architecture can move data quickly, but movement alone does not answer every analytical question. A real-time analytics database gives technical teams a query layer for fresh data, historical context, and concurrent analytical access.
Database Types to Consider
The right database for real-time analytics depends on the workload. Technical teams should evaluate the ingestion pattern, latency target, query complexity, concurrency, retention period, and operational model before comparing products. The broader database types landscape is best understood across several dimensions: data model, workload pattern, storage format, and deployment model.
Columnar analytical databases fit workloads with large scans, aggregations, and analytical SQL. They are often used when teams need low-latency analytical queries across large datasets, especially for dashboards, reporting, and operational analysis.
Real-time OLAP databases fit event-heavy workloads where users or applications need low-latency aggregations. They are commonly used for user-facing analytics, observability, clickstream analysis, fraud monitoring, and IoT telemetry.
Distributed SQL databases fit teams that need SQL access, scale-out execution, and support for concurrent analytical workloads. They can reduce the need to move data into separate systems when recent and historical data need to be queried together.
Cloud data warehouses with real-time features can fit organizations that already run a warehouse-first architecture. They may work well when governance, ecosystem integration, and existing data models matter more than sub-second query targets.
The right choice is not determined by category alone. It is the system that meets the workload’s freshness, latency, SQL, concurrency, retention, governance, and cost requirements under production conditions.
How To Evaluate the Performance
Performance evaluation should reflect the production workload, not a single benchmark query. This is also a database scalability question: the system must maintain reliable query execution as data volume, users, and query complexity increase.
Start by defining the freshness window, query latency target, concurrency level, data volume, retention period, and expected ingestion rate.
Ingestion latency measures how long it takes for new data to become available for analysis. Query latency measures how quickly the database returns results once the data is available. Both metrics matter because a low-latency query has limited value if the data behind it is stale.
Technical teams should measure p95 and p99 latency, not only average response time. Tail latency shows whether dashboards, APIs, and analytical workflows stay predictable when multiple users or systems query the database at the same time.
Concurrency testing should include the mix of workloads expected in production. For example, a test should account for live ingestion, dashboard refreshes, ad hoc SQL, scheduled jobs, and API-driven queries running at the same time.
Historical context also belongs in the test. A workload that performs well on recent records may behave differently when queries join fresh events with large dimension tables, historical transactions, or long-retention datasets.
Cost should be evaluated under the same ingestion, query, concurrency, and retention conditions. Storage price alone does not show the cost of continuous ingestion, concurrent querying, workload isolation, scaling, and operational support.
A practical evaluation should answer these questions:
- How quickly does new data become queryable?
- What are the p95 and p99 query latencies under concurrent load?
- How does performance change during continuous ingestion?
- Can the database query recent and historical data in the same workload?
- Which SQL patterns create the most pressure on the system?
- How does cost change as ingestion, concurrency, and retention increase?
- What monitoring and recovery processes are required in production?
The goal is not to find the lowest isolated query time. The goal is to identify the database that meets the workload’s freshness, latency, concurrency, SQL, retention, and cost requirements under realistic operating conditions.
How To Implement a Real-time Analytics Database
Implementation starts with the workload, not the platform. Define which decisions, dashboards, applications, or workflows need more current data than the existing batch process can provide.
Start with latency requirements. A fraud alert, operational dashboard, and executive report may all use recent data, but they do not need the same freshness window. Define whether the workload needs data in seconds, minutes, or on a scheduled reporting cycle.
Next, map the data sources. Common sources include application events, transactions, logs, IoT data, SaaS systems, and change data capture feeds. Each source needs an ingestion pattern that matches its volume, change frequency, and reliability requirements. For a broader process, use a step-by-step database design workflow that moves from requirements to conceptual, logical, and physical implementation.
Choose where transformation happens. Some teams clean, enrich, or aggregate data before it reaches the database. Others load data first and transform it with SQL. The right pattern depends on latency targets, data quality rules, and how often query logic changes.
Design the data model around query patterns. Real-time analytics often needs time-based filters, joins to reference data, aggregations, and recent-to-historical comparisons. Depending on the database, partitioning, sort order, materialized views, or pre-aggregations can reduce query latency when the workload is known. This follows the same principle as database design: structure schemas around dominant access paths, aggregation needs, and workload behavior.
Test with production-like conditions before deployment. The test should include live ingestion, concurrent dashboards, ad hoc SQL, historical joins, and expected retention volumes. A design that works for recent events alone may fail when the same queries run against months or years of data.
Operational monitoring should cover ingestion delay, query latency, failed loads, resource usage, and workload contention. Teams also need recovery processes for delayed pipelines, duplicate events, late-arriving data, and schema changes.
The implementation is ready when the database meets the defined freshness, query latency, concurrency, SQL, retention, and recovery requirements under realistic operating conditions.
Where Exasol Fits
Exasol is built for analytical workloads that require SQL performance, concurrency, and large-scale data processing. In a real-time analytics architecture, it can serve as the queryable analytics layer for teams that need to analyze current and historical data through BI tools, analytical applications, or agentic AI workflows.
This role fits use cases where performance affects operational work. Darmstadt uses Exasol to analyze real-time traffic and environmental data for traffic management decisions. Monsoon reduced report runtimes from 18 hours to minutes while gaining real-time visibility into order volumes and inventory levels. WashTec uses Exasol with Dataiku to support predictive maintenance on machine data from connected car wash systems.
For technical teams, the evaluation should stay workload-specific. Test ingestion latency, p95 and p99 query latency, concurrent access, SQL patterns, historical joins, and operating cost before choosing the database layer.
Try Exasol Personal for Free
Run real workloads at full Exasol performance.