

What Is an OLAP Cube?

An OLAP cube is a multidimensional data model used to analyze measures across business dimensions such as time, region, product, and customer segment. It supports analytical queries that aggregate, filter, and compare data across dimensions instead of optimizing for individual transaction lookups.
OLAP cubes support recurring analysis by organizing dimensions, measures, hierarchies, and aggregations before users query the data. Teams use OLAP cubes for reporting, dashboarding, financial planning, and performance analysis when users need to slice, dice, drill down, roll up, or pivot defined metrics.
An OLAP hypercube is an OLAP cube with more than three dimensions. In OLAP contexts, “cube” often refers to the multidimensional structure used for analysis, even when the model contains more than three dimensions.
Key Facts
| Concept | Meaning |
|---|---|
| OLAP | Online analytical processing |
| OLAP cube | Multidimensional model for analytical queries |
| Measure | Numeric value such as revenue, margin, cost, or quantity |
| Dimension | Category used to analyze measures, such as time, region, or product |
| Common operations | Slice, dice, drill down, roll up, and pivot |
| Related term | OLAP hypercube |
How an OLAP Cube Organizes Data
An OLAP cube organizes measures and dimensions before query time. Measures are numeric values, such as revenue, cost, margin, or quantity. Dimensions define how teams group, filter, and aggregate those measures. The model also defines hierarchies and aggregation rules so queries can move between summary and detail.
This structure fits recurring analysis paths. A sales team may need revenue by quarter, region, and product category. A finance team may need margin by business unit, scenario, and fiscal period. The cube keeps those paths consistent across reports and dashboards.
Why the model works for recurring analysis
OLAP cubes work well for repeated reporting because the same analytical model can be reused across queries.
Use an OLAP cube when reporting paths are stable and teams repeatedly ask the same questions across the same measures and dimensions. In that case, a cube provides structure, consistent definitions, and predictable aggregation logic. When questions change frequently, a more flexible analytical database or semantic-layer approach is usually a better fit.
Dirk Beerbohm, Global Partner Solution Architect at Exasol, Exasol
OLAP Cube Example
A sales OLAP cube can analyze revenue across time, region, product, and customer segment. Revenue is the measure. Time, region, product, and customer segment are dimensions.
The cube structure defines the measure, dimensions, and hierarchies once, then applies them across repeated analytical queries. A revenue dashboard may show quarterly revenue by region and support drill-down by country, product category, or customer segment.
| Time | Region | Product category | Customer segment | Revenue |
|---|---|---|---|---|
| Q2 2026 | DACH | Database platform | Enterprise | $2.4M |
| Q2 2026 | DACH | Analytics workload | Enterprise | $620K |
| Q2 2026 | Western Europe | Database platform | Mid-market | $890K |
| Q2 2026 | North America | Database platform | Enterprise | $3.1M |
In this example, the cube supports several analytical views from the same model. A sales leader can compare revenue by region. A finance team can roll up monthly revenue into quarterly totals. A product team can analyze revenue by product category and customer segment.
Example business questions
A sales OLAP cube can support questions such as:
- What was revenue by region in Q2 2026?
- Which product category contributed the most revenue in the enterprise customer segment?
- How did mid-market revenue compare across regions?
- Which customer segment drove the largest quarterly change?
- What changed between monthly, quarterly, and yearly views?
These questions use the same cube model. The dimensions and measures stay consistent, while the analytical view changes.
How an OLAP Cube Works
An OLAP cube works by structuring analytical data before teams query it. It exposes those structures to reporting tools, dashboards, or analytical applications. A typical workflow starts with data from operational systems, such as CRM, ERP, billing, or transaction platforms. That data moves into a data warehouse or analytical database, where teams clean, model, and prepare it for analysis.

The cube layer organizes the prepared data into a multidimensional model. Teams can query the same defined measures across different dimensions, instead of redefining joins and aggregations in each report.
Data preparation
OLAP cubes depend on prepared analytical data. Teams usually transform operational records into structures that support reporting, such as fact tables, dimension tables, and aggregate tables.
A sales transaction table may contain individual orders. The cube model can use that data to calculate revenue by month, region, product category, or customer segment.
Aggregation
Aggregation summarizes detailed records into analytical values. A cube can calculate total revenue by quarter, average order value by region, or margin by product category.
Querying
When someone filters a dashboard, the query references the measures and dimensions defined in the OLAP model. The query may return a high-level summary, a filtered slice, or a more detailed drill-down view.
The result depends on the cube structure. Measures define what gets calculated. Dimensions define how the result is grouped or filtered. Hierarchies define how queries move between summary and detail.
OLAP Cube Operations
OLAP cube operations define how queries navigate measures across dimensions. The main operations are slice, dice, drill down, roll up, and pivot.
Slice
A slice filters the cube by one dimension value. For example, a sales analyst may view revenue for one quarter.
The measure stays the same, while the query narrows the dimensional scope. This operation helps isolate one time period, region, product category, or customer segment.
Dice
A dice operation filters the cube by multiple dimension values. For example, a team may analyze revenue for one quarter, one region, and one customer segment.
Dice creates a smaller analytical subset from the cube. The result supports comparison across specific combinations of time, geography, product, and customer attributes.
Drill down
Drill down moves from summary data to more detailed data. A dashboard may start with annual revenue, then drill down into quarters, months, and days.
This operation depends on dimension hierarchies. The hierarchy defines which levels are available and how they relate to each other.
Roll up
Roll up aggregates detailed data into a higher-level summary. A finance team may roll up monthly revenue into quarterly or annual totals.
This operation uses the same hierarchy as drill-down, but in the opposite direction. It moves analysis from granular records to summarized views.
Pivot
A pivot changes how dimensions appear in the analytical view. A report may switch from revenue by product to revenue by region.
OLAP Cube vs OLAP Hypercube
An OLAP hypercube is an OLAP cube with more than three dimensions. The term “cube” describes a multidimensional analytical model, not only a three-dimensional shape.
A cube may analyze revenue by time, product, and region. A hypercube adds more dimensions, such as customer segment, channel, scenario, currency, or sales organization.
Why analytical models may need more than three dimensions
Business questions often combine time, geography, product, customer, and channel context. A sales team may need to analyze revenue by quarter, region, product category, customer segment, and sales channel.
Measures define what gets calculated. Dimensions define how the result is grouped, filtered, or compared. Hierarchies define how queries move between summary and detail.
A hypercube extends the cube model across additional dimensions. Those added dimensions create more query paths, but they also require clear definitions, controlled hierarchies, and consistent aggregation rules.
OLAP Cube vs Relational Table
A relational table stores rows and columns. An OLAP cube organizes analytical data around measures, dimensions, hierarchies, and aggregations.
Relational tables support record-level storage, joins, filtering, and updates. OLAP cubes support repeated analysis across predefined business dimensions.
Example difference
A record-level SQL query may ask:
SELECT
    order_id,
    order_date,
    customer_id,
    product_id,
    revenue
FROM sales_orders
WHERE order_id = 100245;
An OLAP-style query may ask:
SELECT
    region,
    DATE_TRUNC('quarter', order_date) AS quarter,
    SUM(revenue) AS total_revenue
FROM sales_orders
GROUP BY
    region,
    DATE_TRUNC('quarter', order_date);
Syntax varies by database; this example uses common analytical SQL notation.
The first query retrieves a specific order. The second query aggregates revenue by region and quarter.
When each model fits
Relational tables fit record-level storage, joins, staging, transactional systems, and many analytical data warehouse models. OLAP cubes fit reporting environments that reuse the same measures, dimensions, and hierarchies across dashboards and analytical queries.
In practice, both structures often work together. Relational tables store source, staging, fact, dimension, or aggregate data. The OLAP cube organizes that data for recurring analysis.
OLAP vs OLTP
OLAP and OLTP support different database workloads. OLAP supports analytical queries across prepared, historical, or aggregated data. OLTP supports transaction processing for operational applications.
| Category | OLTP | OLAP |
|---|---|---|
| Full term | Online transaction processing | Online analytical processing |
| Primary workload | Operational transactions | Analytical queries |
| Data pattern | Current, detailed transaction records | Prepared, historical, or aggregated analytical data |
| Typical query | Insert an order or update an account | Analyze revenue by quarter and region |
| Query shape | Short, frequent, record-level operations | Larger scans, joins, and aggregations |
| Common users | Applications, operations teams, customer-facing systems | Analysts, finance teams, BI teams, reporting applications |
| Main design goal | Reliable transaction processing | Fast, consistent analysis and reporting |
How OLTP systems work
OLTP systems process operational events such as orders, payments, account updates, inventory changes, and customer interactions. They prioritize transaction volume, data integrity, and fast record-level access.
How OLAP systems work
OLAP systems analyze data from operational and analytical sources. The data often moves into a data warehouse, analytical database, or modeled reporting environment before analysis.
An OLAP query may calculate revenue by quarter, margin by product category, or customer count by region. These queries typically aggregate groups of records rather than retrieve or update one transaction.
Why OLAP cubes are part of OLAP
An OLAP cube is one way to structure data for online analytical processing. It organizes measures, dimensions, hierarchies, and aggregations so teams can query recurring measures across defined views.
A cube is a modeling approach used within OLAP environments. Modern OLAP architectures may also use relational data warehouses, analytical databases, materialized views, aggregate tables, or semantic modeling layers.
Types of OLAP Models: MOLAP, ROLAP, and HOLAP
OLAP systems use different storage and query models. The main OLAP model types are MOLAP, ROLAP, and HOLAP.
MOLAP
MOLAP stores analytical data in a multidimensional structure. Aggregations can be precomputed or stored so recurring queries return summary values quickly.
MOLAP fits stable reporting paths with known dimensions and hierarchies. Frequent model changes can increase processing and maintenance work.
ROLAP
ROLAP keeps data in relational tables and uses SQL to answer analytical queries. Measures, dimensions, and hierarchies are modeled over fact tables and dimension tables.
ROLAP fits large relational datasets when teams want to keep analysis close to the warehouse or analytical database.
HOLAP
HOLAP combines multidimensional and relational approaches. Aggregations may be stored in a multidimensional structure, while detailed records remain in relational tables.
HOLAP fits environments that need summary performance and access to detail.
Choosing an OLAP model
The model depends on data volume, query patterns, refresh frequency, and governance requirements.
| Requirement | Likely fit | Reason |
|---|---|---|
| Stable recurring dashboards | MOLAP | Predefined aggregations support repeated analysis |
| Large relational data warehouse | ROLAP | Data stays in relational tables and is queried through SQL |
| Summary queries with detailed drill-through | HOLAP | Aggregations and detail can use different storage models |
| Frequent schema or dimension changes | ROLAP | Relational models can be easier to adapt |
| Predictable financial reporting | MOLAP or HOLAP | Stable hierarchies and aggregations can support governed reporting |
OLAP Cube Architecture
OLAP cube architecture defines how source data becomes a queryable analytical model. The broader database architecture shows how source systems, storage layers, and modeling layers fit together. Source systems feed a data warehouse or analytical database, which prepares data for the cube model and the reporting layer.
A representative architecture includes source systems, an analytical database or data warehouse, prepared fact and dimension tables, a cube model, and a reporting layer.
The cube model sits above prepared analytical data. It defines measures, dimensions, hierarchies, and aggregation rules so BI tools can query analytical structures instead of raw transaction records.
Source systems
Source systems produce operational data from CRM, ERP, billing, commerce, inventory, or transaction platforms. Each record may represent an order, payment, shipment, product update, or customer interaction.
Analytical database or data warehouse
The analytical database or data warehouse stores and processes data for reporting and analysis. Teams transform operational records into fact tables and dimension tables before analysis.
Cube model
The cube model defines the measures, dimensions, hierarchies, and aggregations available to analytical queries. Measures define calculated values such as revenue, margin, quantity, or cost. Dimensions define how those values are grouped or filtered. Hierarchies define how queries move between detail and summary.
Aggregation layer
Aggregations summarize detailed records into higher-level values. A cube may store, precompute, or define aggregations depending on the OLAP model and storage architecture.
BI and reporting layer
BI tools, reports, and dashboards consume the cube model. They use the same measures, dimensions, and hierarchies to present analytical views.
OLAP cubes and semantic layers
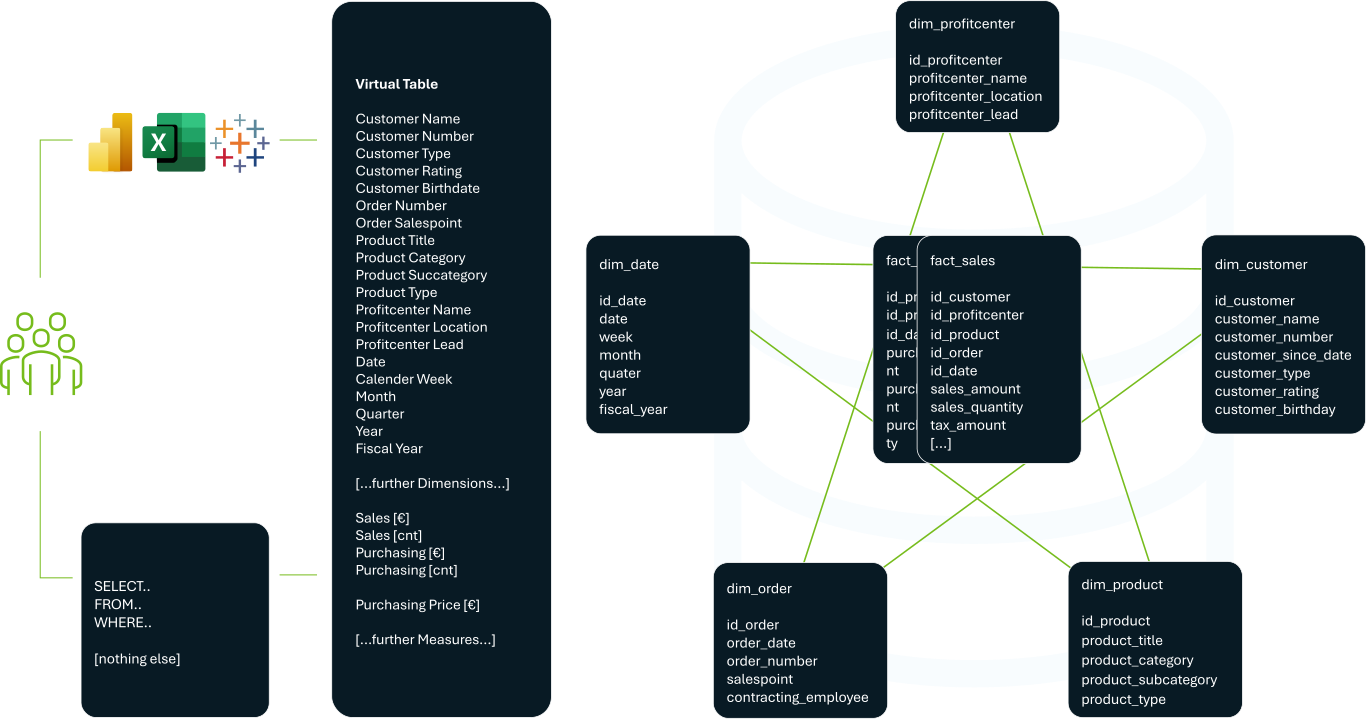
An OLAP cube and a semantic layer solve related modeling problems, but they are not the same architecture. An OLAP cube structures analytical data around measures, dimensions, hierarchies, and aggregations. A semantic layer defines business-facing measures, metrics, relationships, access rules, and query logic across analytical data.
A semantic layer can provide OLAP-style access when it exposes governed measures and dimensions to BI tools. Instead of requiring each tool to recreate joins, calculations, and aggregation logic, the semantic layer centralizes those definitions.
Exasol Semantic Layer follows this pattern by using SQL as the interface for semantic access inside Exasol. It operates as a virtual schema and transforms business-friendly SQL into the underlying joins, aggregations, and calculations needed to query star-schema data.
SQL Example: OLAP-Style Aggregation
SQL can express OLAP-style analysis when measure columns and dimension attributes are available in relational tables. The query groups records by dimension attributes and calculates measures with aggregate functions.
Syntax varies by database. The examples below use common analytical SQL notation.
Aggregating by dimensions
This query calculates revenue by region, product category, and quarter.
SELECT
    region,
    product_category,
    fiscal_quarter,
    SUM(revenue) AS total_revenue
FROM sales_fact
GROUP BY
    region,
    product_category,
    fiscal_quarter;
In this query, revenue is the measure. region, product_category, and fiscal_quarter are dimension attributes. SUM(revenue) creates the aggregated value returned by the query.
Roll-up example
A roll-up query aggregates detailed values into a higher-level summary. This example summarizes revenue at the region level.
SELECT
    region,
    SUM(revenue) AS total_revenue
FROM sales_fact
GROUP BY
    region;
The query groups only by region, so product and quarter no longer define the result. The result summarizes revenue at the region level.
Drill-down example
A drill-down query adds detail to the result. This example moves from regional revenue to country-level revenue.
SELECT
    region,
    country,
    SUM(revenue) AS total_revenue
FROM sales_fact
GROUP BY
    region,
    country;
The query keeps region and adds country. The result shows a more detailed view within each region.
Slice example
A slice filters one dimension to a single value. This example returns revenue for one fiscal quarter.
SELECT
    region,
    product_category,
    SUM(revenue) AS total_revenue
FROM sales_fact
WHERE fiscal_quarter = 'Q2'
GROUP BY
    region,
    product_category;
The measure remains revenue. The filter narrows the query to one time period.
Dice example
A dice query filters multiple dimensions at once. This example returns revenue for one quarter, one region, and one customer segment.
SELECT
    product_category,
    SUM(revenue) AS total_revenue
FROM sales_fact
WHERE fiscal_quarter = 'Q2'
  AND region = 'DACH'
  AND customer_segment = 'Enterprise'
GROUP BY
    product_category;
Q2, DACH, and Enterprise are illustrative filter values. The query creates a smaller analytical subset by filtering time, geography, and customer attributes before aggregating revenue.
What SQL does not replace
SQL can express OLAP-style aggregations, but a raw SQL query is not the same as an OLAP cube. The cube model defines reusable measures, dimensions, hierarchies, and aggregation rules, which reduces repeated logic across queries and reports.
Benefits of OLAP Cubes
Revenue, margin, cost, and quantity can use the same calculation logic across dashboards and reports.
Faster recurring analysis
OLAP cubes can improve recurring query performance when aggregations are stored, precomputed, or defined for repeated access patterns. The performance mechanism depends on the OLAP model, storage mode, and database engine.
Structured multidimensional analysis
A team can compare revenue by time, region, product category, customer segment, or channel.
Reusable reporting model
Reports can use the same measures, dimensions, and hierarchies, reducing the need to redefine the model in each dashboard.
Governed analytical access
OLAP cubes can support governed reporting when definitions, hierarchies, and access rules are controlled centrally. The governance model depends on the OLAP platform and surrounding data architecture.
Limitations of Traditional OLAP Cube Architectures
OLAP cube architectures support recurring analysis, but they can add modeling and maintenance work. The risk increases when business questions, dimensions, or data sources change often. Modeling effort
Modeling effort
A cube model needs clear scope. Teams must decide which measures, dimensions, hierarchies, and aggregation rules belong in the cube. Weak definitions can lead to incorrect reports or inconsistent analytical views.
Refresh latency
Some OLAP cubes depend on scheduled processing or batch refreshes. In those architectures, new data may not appear until the next processing cycle finishes.
Model-change effort
Business changes can require updates to dimensions, hierarchies, measures, or aggregation rules. New products, regions, customer segments, or reporting hierarchies may require model updates.
Maintenance overhead
Cube changes can affect multiple reports. A new dimension, updated hierarchy, changed measure, or revised access rule may alter dashboard results.
Limited ad hoc flexibility
An OLAP cube is strongest when analysis follows known dimensions and measures. Ad hoc questions can be harder when the required fields or relationships sit outside the model.
Are OLAP Cubes Still Relevant?
OLAP cube concepts remain useful because analytical teams still model data through measures, dimensions, hierarchies, and aggregations. The implementation can vary: OLAP-style workloads may use traditional cubes, analytical databases, cloud data warehouses, semantic layers, or BI modeling layers.
The cube concept still helps describe how analytical questions are structured. A business user may ask for revenue by quarter, region, product category, and customer segment.
That question depends on the same cube concepts: measures, dimensions, hierarchies, and aggregations. The physical implementation may be a traditional cube, a relational warehouse model, a semantic layer, or an analytical database.
Some architectures separate the analytical concept from a physical cube. Teams may use SQL models, semantic layers, materialized views, aggregate tables, or analytical databases to support similar query patterns.
These approaches extend the OLAP design space rather than replacing the cube concept. Multidimensional analysis can be delivered through several modeling and execution patterns.
OLAP Cubes vs Analytical Databases
OLAP cubes and analytical databases can support similar analytical questions, but they use different modeling and execution patterns. A cube defines a multidimensional model for recurring analysis. An analytical database executes SQL queries over analytical data.
A cube is strongest when the reporting model is stable and the same measures, dimensions, and hierarchies are reused across dashboards. An analytical database is better when teams need SQL access across detailed and aggregated data, or when query patterns change more often.
The two approaches can work together. An analytical database can store fact tables, dimension tables, aggregate tables, and modeled views that feed cube models, BI tools, or semantic layers. A cube can sit above that data when reporting paths are stable.
OLAP cubes suit recurring analysis that needs a stable multidimensional model. Analytical databases suit workloads that need SQL flexibility, changing query patterns, or broader access to modeled data.
OLAP Cube Best Practices
OLAP cube design should start with the business questions the model needs to answer. Measures, dimensions, hierarchies, and aggregation rules should follow those questions, not every available source-system field. Data warehouse design helps keep those modeling decisions aligned with reporting needs.
Start with recurring questions
A cube should model repeated analytical questions. Examples include revenue by quarter, margin by product category, cost by business unit, or inventory by warehouse.
Define measures clearly
Measures need precise definitions before teams use them in dashboards. Revenue, margin, cost, and quantity should have clear calculation rules, filters, and source mappings.
Keep dimensions controlled
A cube should include dimensions that support recurring analysis. Examples include time, geography, product, customer segment, and channel.
Too many dimensions can make the model harder to process, test, and maintain. Attributes that support rare or exploratory queries may fit better in SQL-accessible tables or views.
Model hierarchies explicitly
Hierarchies define how queries move between summary and detail. Time may move from year to quarter and month. Geography may move from region to country and city.
Validate aggregation rules
Measures need aggregation rules that match their meaning. Revenue and quantity usually sum across dimensions. Ratios, percentages, and averages often need calculated logic.
For example, margin percentage should usually be calculated from aggregated revenue and cost, not summed across rows.
Plan refresh and processing
Cube refresh design affects data availability. Some architectures process cubes on a schedule, while others define aggregations or query data through relational structures.
Document the cube model
Cube documentation should cover measures, dimensions, hierarchies, aggregation rules, source mappings, and access rules. Visible, current model logic makes maintenance more predictable.
FAQs
OLAP cubes are not outdated as an analytical modeling concept. Measures, dimensions, hierarchies, and aggregations are still used to structure recurring business analysis.
What has changed is the implementation pattern. Some environments use traditional cube structures, while others use analytical databases, semantic layers, materialized views, aggregate tables, or BI models to support OLAP-style queries.
In Excel, an OLAP cube is a multidimensional data source that can be queried through PivotTables and related analysis features. It lets users analyze measures across dimensions such as time, product, region, or customer segment.
Excel usually connects to an OLAP source rather than acting as the cube engine itself. The cube defines the measures, dimensions, hierarchies, and aggregations that Excel exposes for analysis.
A sales OLAP cube may analyze revenue across time, geography, product, and customer dimensions. Revenue is the measure. Time, geography, product, and customer segment are dimensions used to group, filter, and compare that measure.
For example, a sales team may query revenue by quarter, region, product category, and customer segment from the same cube model.
The better comparison is OLAP vs OLTP, because OLTP is a workload type, not a cube type.
OLAP supports analytical queries across prepared, historical, or aggregated data. OLTP supports transaction processing for operational applications, such as inserting orders, updating accounts, or retrieving individual records.