

What is an OLAP Database?

An OLAP database stores and queries analytical data for reporting, dashboards, forecasting, and analysis across business dimensions. Teams use OLAP systems when transactional databases cannot support complex aggregations, historical analysis, or high-concurrency analytical workloads at acceptable query latency.
OLAP stands for online analytical processing. The term describes a workload pattern, not one fixed database architecture. Modern OLAP systems often use columnar storage, distributed execution, pre-aggregations, or analytical query engines to scan and summarize large datasets.
OLAP databases support questions such as revenue by region, customer retention by cohort, product usage by month, and operational metrics across millions or billions of rows. They are not designed to replace transactional systems for inserts, updates, and single-record lookups. They separate analytical workloads from operational workloads and give analysts, data teams, and applications direct access to aggregated data.
Quick definition
An OLAP database is a database system optimized for analytical queries over large datasets. It supports aggregation, filtering, grouping, trend analysis, and reporting across historical or modeled data.
| OLAP is used for | Example analytical question |
|---|---|
| Business intelligence | What was revenue by region last quarter? |
| Financial reporting | How did margin change by product line? |
| Customer analytics | Which cohorts retained after 90 days? |
| Product analytics | Which features drive the most usage? |
| Operational analytics | Which systems generate the highest error rates? |
| Forecasting | What demand pattern appears across prior periods? |
What Does OLAP Mean?
OLAP means online analytical processing. The term describes interactive analysis over modeled data, where users query metrics across dimensions such as time, product, customer, region, or channel.
“Online” does not mean public internet access. It means users can query the analytical system directly and receive results without waiting for offline batch reports. “Analytical” refers to calculations across many records, such as totals, averages, ratios, rankings, and period-over-period changes.
“Processing” refers to the query work the system performs after it receives an analytical request. The database scans relevant data, applies filters, joins or groups records when needed, calculates measures, and returns a result set for a dashboard, report, application, or SQL client.

Try Exasol Personal for Free
Run real workloads at full Exasol performance.
How Does an OLAP Database Work?
An OLAP database processes analytical queries against structured data prepared for analysis. Teams often run OLAP workloads outside transactional systems, so reporting and dashboard queries do not compete with application writes.
The workflow usually starts with data from operational systems, event streams, files, or data warehouses. Data teams transform this data into analytical models, then store it in formats optimized for scans, joins, filters, and aggregations.
When a user runs a query, the OLAP system identifies the relevant columns, filters the dataset, joins or groups records when needed, and calculates measures. The result returns to a dashboard, report, application, or SQL client.
| Step | What happens | Example |
|---|---|---|
| Data ingestion | The system collects data from source systems | Orders, payments, events, or product usage logs |
| Data modeling | Teams structure data for analysis | Fact tables, dimension tables, or semantic models |
| Analytical storage | The database stores data for query efficiency | Columnar storage, partitions, or pre-aggregations |
| Query execution | The engine scans, filters, joins, and aggregates data | Revenue by region and month |
| Result delivery | The system returns query results to users or applications | BI dashboard, scheduled report, or SQL client |
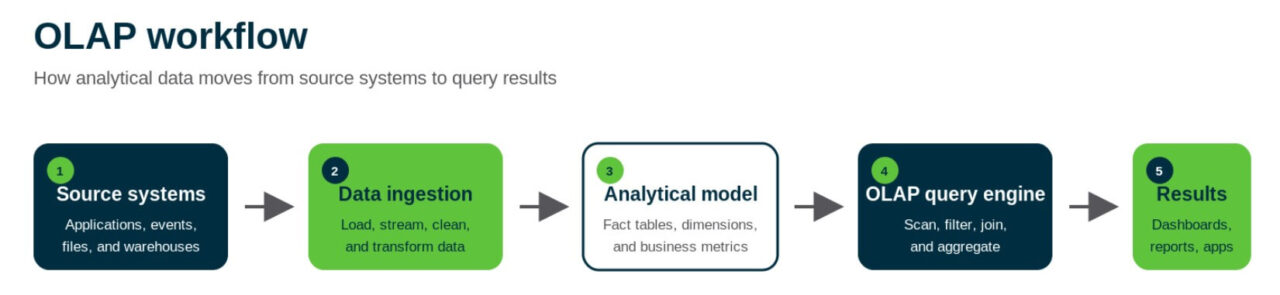
OLAP systems exist because transactional databases optimize for short, consistent operations. Analytical workloads follow a different pattern. They read larger datasets, calculate metrics across dimensions, and often serve many users or dashboards at the same time.
OLAP vs OLTP Database
OLAP and OLTP databases support different workload patterns. OLAP systems analyze data across many records. OLTP systems process transactions that create, update, or retrieve individual operational records.
An OLTP database supports application workflows such as placing an order, updating an account, processing a payment, or changing inventory. These workloads need low-latency writes, consistency, and fast lookups.
An OLAP database supports analytical workflows such as revenue reporting, cohort analysis, forecasting, and operational dashboards. These workloads usually scan larger datasets, group records by dimension, and calculate measures across time periods, regions, products, or customers.
Key differences:
- Workload: OLAP handles analytical queries. OLTP handles transaction processing.
- Operations: OLAP scans, filters, joins, and aggregates. OLTP inserts, updates, deletes, and retrieves records.
- Query scope: OLAP usually reads many rows. OLTP usually touches one or a small number of records.
- Schema design: OLAP uses analytical models, wide tables, fact tables, dimensions, or aggregates. OLTP uses operational schemas optimized for transactions and consistency.
- Main risk: OLAP queries can increase query latency and infrastructure cost when the system is poorly designed. OLTP workloads can face transaction latency, lock contention, or operational load when analytics run on the same system.
Teams often separate OLAP and OLTP workloads when analytical queries start to affect operational systems. The separation gives each system a clearer role: OLTP handles application state, while OLAP handles analysis and reporting.
OLAP Database Architecture
An OLAP database architecture connects data sources, pipelines, analytical storage, a query engine, and a consumption layer. These components prepare operational, event, or warehouse data for analytical queries.
Source systems provide the input data. Common sources include transactional databases, application events, product usage logs, financial systems, CRM systems, ERP systems, files, data lakes, and existing data warehouses.
Data pipelines move and prepare this data for analysis. Teams use ETL or ELT processes to clean records, standardize fields, join sources, validate data quality, and create structures analysts can query.
The analytical storage layer holds data in formats suited to reads, scans, and aggregations. OLAP systems often use columnar storage, partitions, materialized views, pre-aggregations, distributed storage, or semantic models to reduce query work.
The query engine executes analytical requests. It scans relevant columns, applies filters, joins records when needed, calculates measures, and returns results to BI tools, reports, applications, or SQL clients.
Common OLAP architecture components include:
- Source systems: Operational databases, applications, files, event streams, and external systems.
- Data pipeline: Ingestion, transformation, validation, and loading processes.
- Analytical model: Tables, dimensions, measures, aggregates, or semantic models.
- OLAP query engine: The layer that executes scans, joins, filters, and aggregations.
- Consumption layer: BI dashboards, reports, embedded analytics, applications, and SQL clients.
This architecture exists because analytical workloads need different physical and logical database design choices than transactional workloads. OLTP systems prioritize writes, consistency, and short transactions. OLAP systems prioritize read performance, aggregation speed, historical analysis, and concurrency for analytical users.
Types of OLAP Databases
Traditional OLAP systems are often grouped as MOLAP, ROLAP, and HOLAP. Modern analytical databases extend this model with columnar storage, distributed execution, and SQL-based query engines.
MOLAP stands for multidimensional OLAP. It stores data in multidimensional cubes, where measures are organized by dimensions such as time, product, region, or customer. Teams use MOLAP when they need fast analysis over predefined dimensions and stable reporting structures.
ROLAP stands for relational OLAP. It stores or accesses analytical data through relational tables and SQL-based queries. Teams use ROLAP when they need analytical access to relational datasets, larger data volumes, or schemas that change more often than cube structures.
HOLAP stands for hybrid OLAP. It combines multidimensional and relational approaches. Teams use HOLAP when they need cube-style aggregations for summary data and relational access for larger or more detailed datasets.
Modern OLAP systems often use columnar storage, distributed execution, vectorized processing, compression, materialized views, or separation of compute and storage. These systems support analytical workloads such as BI dashboards, embedded analytics, product analytics, event analytics, and large-scale reporting.
Systems that commonly support OLAP workloads include:
- Columnar analytical databases: Store data by column to reduce scan work for aggregation-heavy queries.
- Cloud data warehouses: Provide managed infrastructure for BI, reporting, and SQL analytics.
- Lakehouse query engines: Query analytical data in object storage, open table formats, or data lake environments.
- Semantic-model-driven systems: Define business metrics, dimensions, hierarchies, and governed reporting logic.
The right database type depends on the workload. Stable financial reporting may fit cube-based or semantic-model-driven systems. High-volume event analytics, embedded analytics, or customer-facing dashboards often need columnar storage, distributed execution, and predictable query latency under concurrency.
Try Exasol Personal for Free
Run real workloads at full Exasol performance.
OLAP Database Examples
OLAP databases support queries that summarize data across time, products, customers, regions, systems, or other business dimensions. These queries usually read many records and return aggregated results.
A common OLAP example is revenue analysis. An analyst may query total revenue by month, region, and product category to compare performance across periods.
Note: SQL syntax varies by database. This example shows a common analytical query pattern.
SELECT
    DATE_TRUNC('month', order_date) AS order_month,
    region,
    product_category,
    SUM(revenue) AS total_revenue,
    COUNT(*) AS order_count
FROM sales_orders
WHERE order_date >= DATE '2025-01-01'
GROUP BY
    DATE_TRUNC('month', order_date),
    region,
    product_category
ORDER BY
    order_month,
    total_revenue DESC;
This query reads historical order data, groups records by time, region, and product category, then calculates revenue and order count. The result can feed a BI dashboard, financial report, or ad hoc analysis.
Retail Analytics Example: Monsoon Accessorize
Monsoon Accessorize used Exasol as the analytical database layer behind its BI reporting. The company rebuilt its presentation layer on Exasol with fact and dimension tables, including tables with billions of rows.
This is a practical OLAP database pattern. Business users needed to analyze sales, stock, product movement, purchase orders, customer behavior, and operational metrics without waiting for the BI team to create every report.
The workload fits OLAP because users queried historical and operational data across business dimensions. Monsoon reduced critical reporting runtimes from 18 hours to minutes or seconds, which shows the role of an analytical database in reporting and self-service analysis.
Other OLAP examples include:
- Customer analytics: Retention by signup cohort, plan type, or acquisition channel.
- Product analytics: Feature usage by account segment, region, or subscription tier.
- Financial reporting: Margin, revenue, cost, or forecast variance by period.
- Operational analytics: Error rates, latency, or event volume by service.
- Supply chain analytics: Inventory movement, delivery performance, or demand by location.
These examples share the same workload pattern. These examples usually require the system to scan analytical data, apply filters, group records by dimension, and calculate measures for reporting or analysis.
Common OLAP Operations
OLAP operations help users move through analytical data at different levels of detail. They support questions such as what changed, where it changed, which segment contributed to the change, and how one metric compares across dimensions.
Roll-up summarizes data at a higher level. A sales team may roll up daily revenue into monthly revenue, or store-level revenue into regional revenue.
Drill-down moves from summary data into more detailed data. A finance team may start with quarterly revenue, then drill down into month, region, product line, and customer segment.
Slice filters the analysis to one dimension value. An analyst may view revenue for one region, one product category, or one quarter.
Dice filters the analysis across multiple dimension values. A product team may analyze enterprise customers in North America during the last 90 days for one subscription tier.
Pivot changes the layout of the analysis. A report may show revenue by region first, then pivot to show revenue by product category across the same time period.
These operations exist because analytical users often need more than one static report. They need to change the level of detail, isolate segments, compare dimensions, and test business questions without rebuilding the dataset.
When to Use an OLAP Database?
Use an OLAP database when analytical queries start to interfere with operational systems or require a separate analytical layer. Common signals include slow dashboards, long-running reports, high concurrency from BI users, and aggregation queries that compete with application workloads.
OLAP fits workloads that read and summarize large datasets. These workloads often analyze historical records across time, product, customer, region, channel, or system dimensions.
Teams also use OLAP databases when they need consistent metrics across reporting workflows. The analytical layer can define shared measures, dimensions, and aggregation logic so teams do not calculate the same metric differently across tools.
Use an OLAP database when you need to:
- Analyze historical data across many records.
- Run aggregations, joins, filters, and time-based comparisons.
- Support BI dashboards, scheduled reports, or embedded analytics, where teams need clear, scan-friendly views of metrics, trends, and operational changes.
- Separate reporting workloads from transactional systems.
- Give analysts and business users direct access to governed metrics.
- Query data across multiple business dimensions.
An OLAP database is not the right primary system for transaction-heavy application workflows. Use an OLTP database for frequent inserts, updates, deletes, and single-record lookups that require transactional consistency.
The boundary is workload-driven. A transactional database may support small reporting queries. Analytical workloads need a separate OLAP layer when query volume, data size, concurrency, or latency requirements exceed what the operational system can handle.
Try Exasol Personal for Free
Run real workloads at full Exasol performance.
How to Choose an OLAP Database
Choose an OLAP database based on workload shape, not product category alone. The main inputs are data volume, query latency, concurrency, data freshness, SQL support, integration requirements, and operational complexity.
Start with query patterns. A BI dashboard workload may need predictable response times under many concurrent users. An ad hoc analytics workload may need flexible SQL, broad joins, and access to detailed historical data.
Data freshness also affects the architecture. Batch reporting may tolerate scheduled loads. Operational analytics, product analytics, and embedded analytics often need shorter ingestion intervals and lower query latency.
Evaluate these criteria before selecting an OLAP system:
- Query performance: Test representative filters, joins, aggregations, and time-based comparisons.
- Concurrency: Measure performance with the expected number of BI users, analysts, applications, or scheduled jobs.
- Data freshness: Define whether the workload needs batch, near-real-time, or real-time ingestion.
- Scale: Estimate current data volume, growth rate, retention period, and queryable history.
- SQL support: Check compatibility with analyst workflows, BI tools, and existing query patterns.
- Data modeling: Confirm support for fact tables, dimensions, wide tables, aggregates, or semantic models.
- Operations: Account for deployment, maintenance, monitoring, tuning, backup, and recovery.
- Cost model: Compare compute, storage, concurrency, data movement, and administrative overhead.
The database should match the dominant analytical workload. A finance reporting system may prioritize governed metrics and stable schemas. A customer-facing analytics application may prioritize concurrency and predictable latency. If the application serves fresh operational data, ingestion speed also matters. A data science workload may prioritize access to detailed history and flexible SQL exploration.
Frequently Asked Questions
OLAP means online analytical processing. In a database context, OLAP refers to analytical workloads that query large datasets for reporting, dashboards, forecasting, and business analysis. An OLAP database usually supports scans, filters, joins, aggregations, and calculations across dimensions such as time, product, region, or customer.
SQL is not OLAP. SQL is a query language, while OLAP is an analytical processing pattern. Many OLAP databases support SQL so analysts and applications can query metrics, aggregate data, and analyze historical records.
The best database for OLAP depends on the workload. BI reporting, embedded analytics, financial planning, product analytics, and event analytics can require different trade-offs across query latency, concurrency, data freshness, scale, SQL support, and operational complexity. Choose based on representative queries and workload requirements, not product category alone.
Examples of systems used for OLAP workloads include multidimensional OLAP systems, relational OLAP systems, columnar analytical databases, cloud data warehouses, and lakehouse query engines. These systems support analytical queries such as revenue by month, retention by cohort, product usage by segment, or error rates by service.