
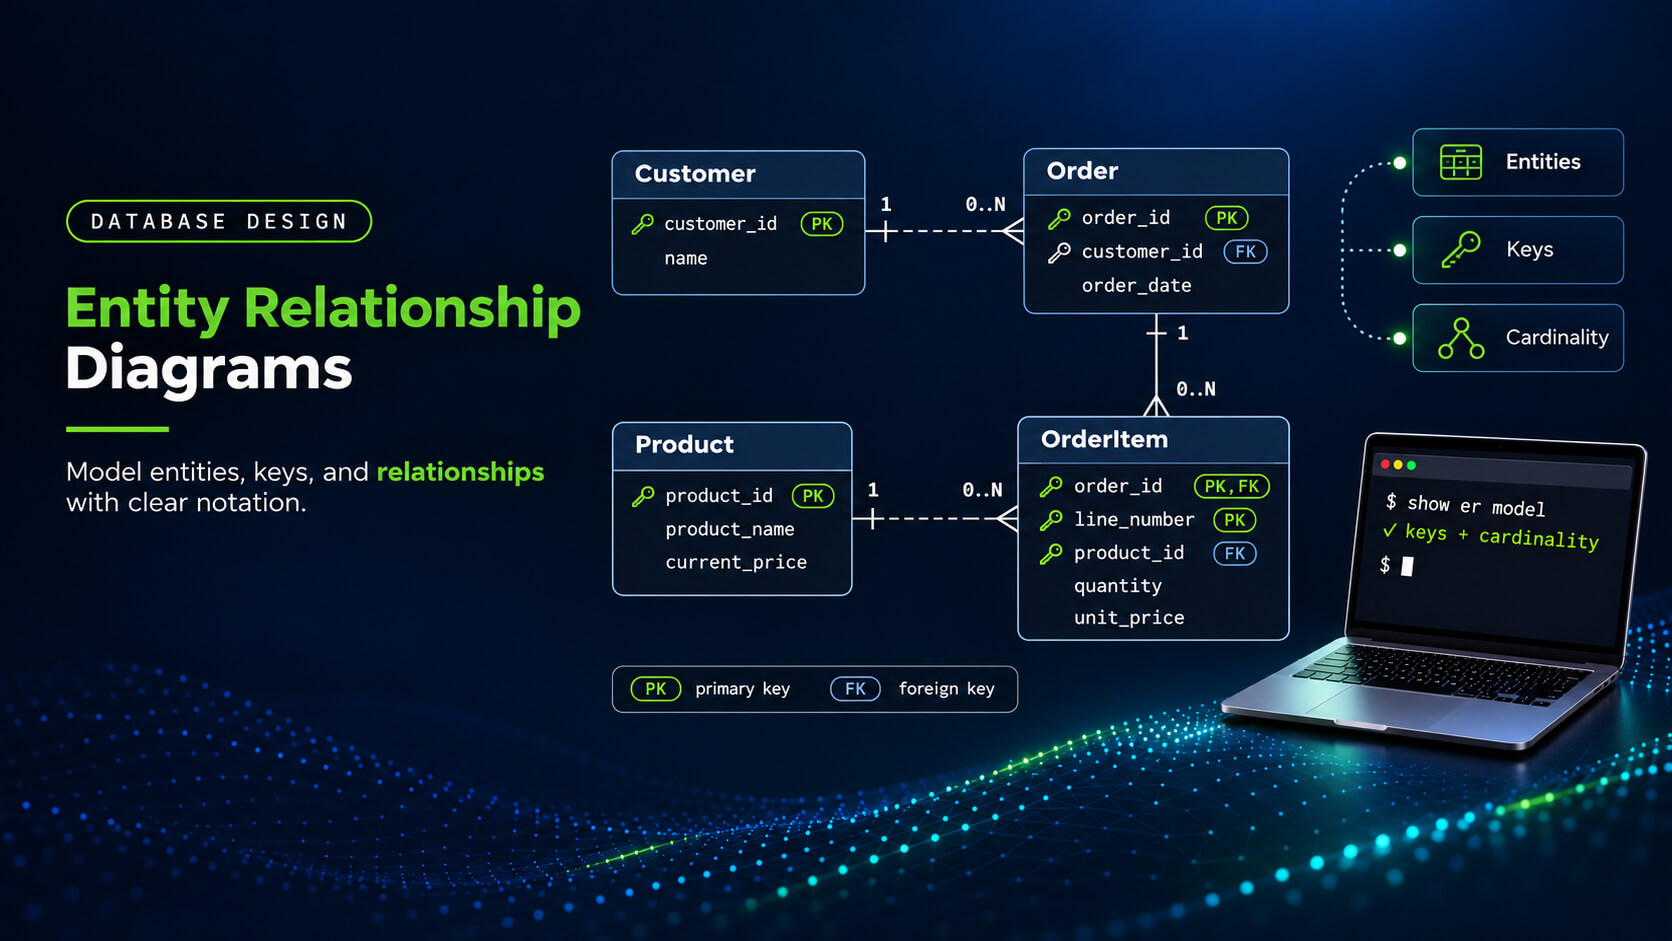
Entity Relationship Diagrams: Components, Notation, and Examples

An entity relationship diagram (ERD) visually represents entities and relationships and can include attributes relevant to the model. Engineers use ERDs to review how entities connect and whether the model reflects the intended business rules.
In the worked example, each order record represents one order, while each order-line record represents one line. This guide uses customers, orders, products, and order lines to explain notation, relationship rules, and identifier choices.
What an ER Diagram Shows
Entities and attributes
An entity type defines a category of objects or concepts, such as customers, orders, or products. Customer names the type, while a particular customer is an instance of that type.
Attributes describe properties recorded about entities, such as a product’s name or an order’s placement date. In this model, Product includes product_name and current_price, while Order includes order_date. OrderItem represents a line within an order, with attributes such as quantity and unit_price.
Identifiers and keys
An identifier distinguishes one instance from others of the same entity type. In our model, customer_id, order_id, and product_id identify customers, orders, and products.
In a relational implementation, a primary key uniquely identifies each row through one or more columns. In this example, orders.customer_id is a foreign key referencing the primary key customers.customer_id.
A strong entity has an identifier that doesn’t depend on another entity’s identifier. A weak entity relies on an owner entity’s identifier as part of its identification. Here, OrderItem uses (order_id, line_number) because a line number is unique only within its order. The distinction concerns identification, so a foreign key alone doesn’t make an entity weak.

Try Exasol Personal for Free
Run real workloads at full Exasol performance.
Relationships and business rules
Relationships describe associations between entity instances, such as a customer placing an order. Names such as places, contains, and references explain how the entities relate within the model.
Business rules determine how many instances can participate and whether that participation is required. Our example permits zero or more orders per customer, while each order references exactly one customer. These rules establish the relationship’s minimum and maximum participation, which the diagram’s notation must express.
Orders and products have a many-to-many association, represented here through individual OrderItem instances. Each order line records its own quantity and agreed price for the product it references.
Conceptual, Logical, and Physical ER Diagrams
ER diagrams can describe business concepts, logical structures, or implementation details for a particular database system. The chosen level guides which details to include and how closely the diagram represents a database implementation.
| Level | Focus | Typical contents | Order-processing example |
|---|---|---|---|
| Conceptual | Business meaning and scope | Entity types, major relationships, and business rules | Customers place orders; orders can contain product lines. |
| Logical | Structure within a chosen data model | Attributes, identifiers, key relationships, cardinality, and optionality | OrderItem uses (order_id, line_number) as its identifier and relates to Order and Product. |
| Physical | Implementation in a selected database system | Database-specific table, column, and constraint details | order_date uses a supported date type; unit_price uses a decimal type with specified precision and scale. |
Terminology varies across methods and tools, so check what a diagram’s level actually includes. Logical relational diagrams can show primary and foreign keys without selecting database-specific types or storage settings.
In this guide, the worked example is a logical relational ERD with selected attributes and identifiers. It shows how the modeled records relate without specifying a complete implementation for any database system. These levels describe a particular design, while database models define broader approaches to organizing data and relationships.
How to Read ER Diagram Symbols and Relationships
Read an ER diagram using its stated notation, endpoint markers, and rules for interpreting relationship lines. The same shape or line style can carry different meanings across diagramming conventions and tools.
Chen and Crow’s Foot notation
Chen and Crow’s Foot are two conventions for drawing entities, attributes, and relationships in ER diagrams. Chen notation uses rectangles for entities, ovals for attributes, and diamonds for relationships.
Crow’s Foot notation lists attributes inside entity boxes and uses endpoint markers to show relationship counts. This guide uses Crow’s Foot for the main model and keeps the Chen comparison separate.
| Component | Chen notation | Crow’s Foot convention used here |
|---|---|---|
| Entity type | Named rectangle | Named box containing selected attributes |
| Attribute | Oval connected to its entity | Entry inside the entity box |
| Relationship | Named diamond connected to participating entities | Labeled line with markers at both ends |
Cardinality and optionality
Cardinality describes permitted relationship counts; optionality specifies whether participation is required for an instance of an entity. Here, minimum participation determines optionality, while the maximum distinguishes one from many at each endpoint.
| Endpoint markers | Meaning | Minimum | Maximum |
|---|---|---|---|
| Two bars | Exactly one | One | One |
| Circle and bar | Zero or one | Zero | One |
| Bar and crow’s foot | One or more | One | Many |
| Circle and crow’s foot | Zero or more | Zero | Many |
Each endpoint specifies how many instances of its entity can relate to one instance at the opposite end. The marker nearest the entity shows the maximum; the marker farther along the line shows the minimum.
In our example, the circle and crow’s foot beside Order allow a customer to have zero or more orders. The two bars beside Customer require each order to relate to exactly one customer.
Identifying and non-identifying relationships
In this logical relational model, an identifying relationship incorporates the parent’s key into the child’s primary key. A non-identifying relationship references the parent without including that reference in the child’s primary key.
The Order–OrderItem relationship is identifying because order_id forms part of the line’s identifier, (order_id, line_number). The Product–OrderItem relationship is non-identifying because product_id isn’t part of that identifier, although each line requires a product.
This guide uses solid lines for identifying relationships and dashed lines for non-identifying relationships. Those styles describe identification; the endpoint markers separately describe how many instances may or must participate.
In my experience, reviewing an ER diagram means testing what the business allows, including cases that are easy to overlook. Can a customer exist without orders, and can the same product appear on separate order lines? I check those cases against the relationship markers and identifiers before reviewing how joins affect report counts.
Dirk Beerbohm, Global Partner Solution Architect at Exasol, Exasol
Entity Relationship Diagram Example: Customers, Orders, and Products
This illustrative model connects customers, orders, catalog products, and the individual lines within each order. The diagram shows selected attributes and identifiers, with relationship limits based on the stated business rules.
Define the business rules
Each Order instance represents one customer order, and each OrderItem instance represents one line within an order. Customer represents a purchaser, while Product represents a catalog entry that can appear on different order lines.
- A customer can place multiple orders, but customers may also exist without placing any orders.
- Each order belongs to one customer and can contain zero or more order lines.
- Each order line belongs to exactly one order and references exactly one product in this model.
- A product can appear on multiple order lines or remain in the catalog without any lines.
- The same product can appear on multiple lines within an order, each with its own line number.
Illustrative logical relational ERD with selected attributes
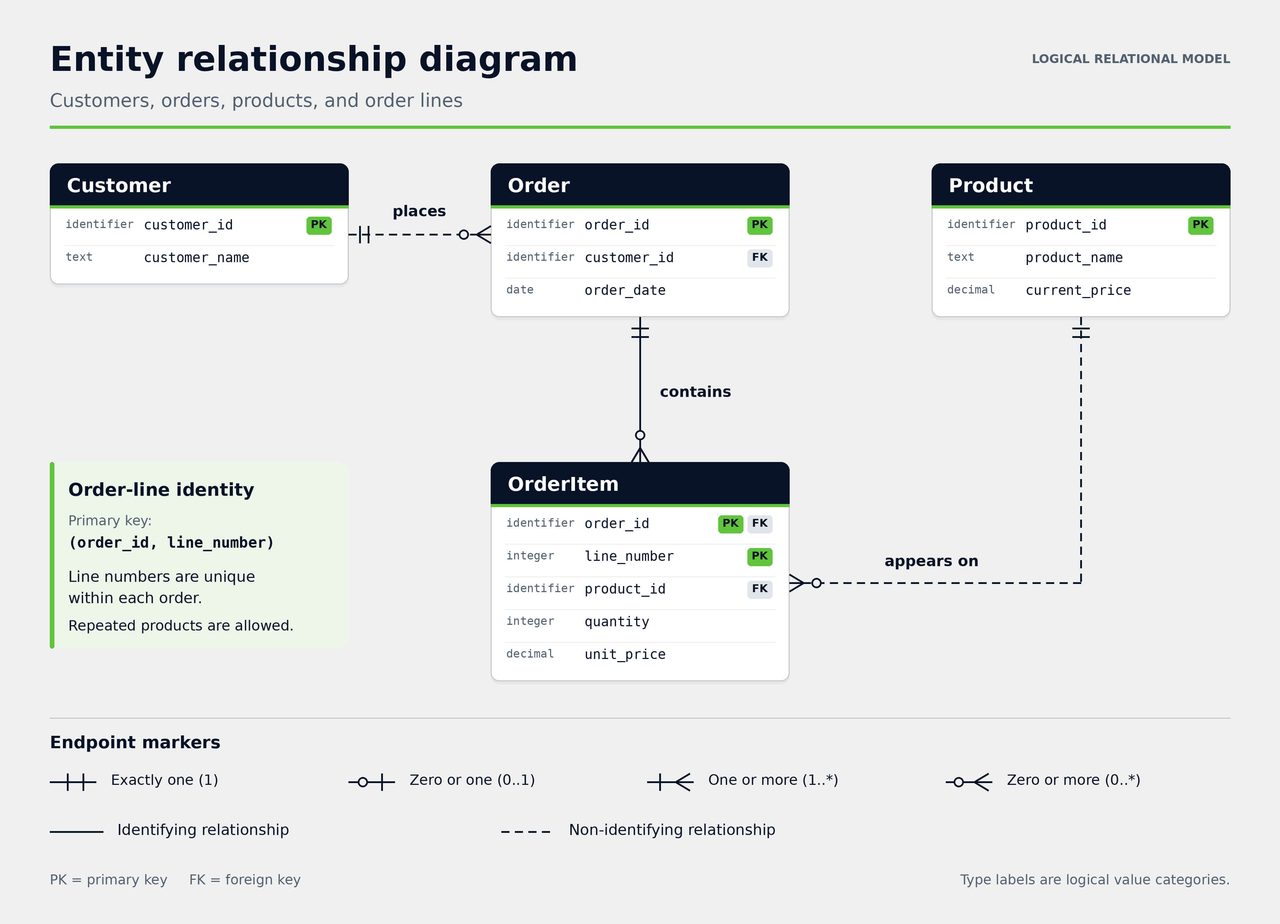
PK labels primary-key attributes; FK labels foreign-key attributes referencing the primary key of another entity. OrderItem has one composite primary key comprising order_id and line_number; both fields carry the PK label.
The type labels indicate logical value categories without choosing a database system or complete SQL declarations. Solid lines show identifying relationships; dashed lines show non-identifying relationships, using the convention defined above.
Read the relationships in both directions
Each endpoint describes the permitted number of instances relative to one instance at the opposite end. Reading both directions checks whether the diagram expresses the intended rules for both participating entity types.
| Relationship | From the first entity | From the second entity |
|---|---|---|
| Customer–Order | Zero or more orders per customer | Exactly one customer per order |
| Order–OrderItem | Zero or more lines per order | Exactly one order per line |
| Product–OrderItem | Zero or more lines per product | Exactly one product per line |
OrderItem represents the many-to-many association between orders and products, with each instance describing one order line. The line also records quantity and unit_price, which describe that occurrence of the product.
Here, current_price holds the product’s catalog price, while unit_price records the price agreed for that line. Separate attributes let an existing line retain its agreed price when the catalog price changes.
Choose an identifier for each order line
In this example, line_number is unique within an order, so (order_id, line_number) identifies an order line. Consider these illustrative line records, where product 501 appears on two separate lines of order 101.
| order_id | line_number | product_id |
|---|---|---|
| 101 | 1 | 501 |
| 101 | 2 | 501 |
| 102 | 1 | 501 |
The first two rows share an order and product, but their line numbers distinguish them. The third row reuses line number one in another order without duplicating the composite identifier.
Storing the first two rows together would violate a primary key on (order_id, product_id). In this design, OrderItem is weak relative to Order because its identifier depends on the order. The identifier choice follows this example’s repeated-product rule; other business rules may support a different key.
How to Create an Entity Relationship Diagram
Use this workflow when creating a new ER diagram or revising one after requirements change. It follows the decisions in the worked example, from business rules through identifiers and relationship limits.
- Define the scope and business rules. State what the diagram needs to explain and which processes or data fall outside its scope. Record whether orders can exist without lines and whether one order can contain separate lines for the same product.
- Choose the modeling level and notation. Choose conceptual, logical, or physical detail according to the questions the diagram must answer. Use one notation consistently and include a legend for its endpoint markers and relationship line styles.
- Identify entities, attributes, and identifiers. Name each entity and define what one instance represents, adding attributes and identifiers appropriate to the modeling level. In the worked example, the identifier must distinguish separate lines for the same product within one order.
- Draw relationships and specify participation. Connect the entities with named relationships, then specify the minimum and maximum participation at each end. Mark identifying relationships according to the selected identifiers and the line-style convention stated in the legend.
- Validate the model against representative records. Walk through representative records and boundary cases, checking the diagram against the rules recorded in step one. Revise the model wherever a valid business case contradicts its identifiers, relationship limits, or attribute meanings.
Treat these steps as an iterative workflow, revisiting earlier decisions when requirements or validation findings change. ER modeling fits within the broader database design process, which also covers implementation, testing, and later changes.
Try Exasol Personal for Free
Run real workloads at full Exasol performance.
How to Review an ER Diagram
Review the diagram against its business rules, representative records, and the questions it needs to answer. An ERD can represent a relationship correctly while a report built from it counts the wrong business object.
Check identity, cardinality, and optionality
Confirm that identifiers distinguish the intended records and that both endpoints agree with the written relationship rules. Use the following boundary cases to check the worked model’s optionality and order-line identity.
| Boundary case | Expected result in this model |
|---|---|
| Customer without orders | Allowed by the zero minimum at the Order end of Customer–Order. |
| Order without lines | Allowed by the zero minimum at the OrderItem end of Order–OrderItem. |
| Same product on separate lines of one order | Allowed when the lines have different line_number values within that order. |
Check joins and reporting grain
Reporting grain describes the level of detail represented by each row in a report or intermediate result. Decide whether the report needs an order count or a line count before choosing its aggregation.
Use an illustrative parent set containing only orders 101, 102, and 103, keeping the three order-line records above. Compare an inner join and a left join from orders to order_items, matching their order_id values. Assume no additional filters, grouping, or row deduplication; the table shows expected rows before aggregation.
| order_id | Matching line numbers | Inner-join rows | Left-join rows |
|---|---|---|---|
| 101 | 1 and 2 | 2 | 2 |
| 102 | 1 | 1 | 1 |
| 103 | None | 0 | 1 |
An inner join produces three rows but includes only two distinct orders, omitting the empty order. A left join preserves all three orders and produces four rows, including one with null line attributes.
On that left-join result, COUNT(*) counts four rows, while COUNT(order_items.line_number) counts three matching lines. COUNT(DISTINCT orders.order_id) counts the three distinct order identifiers represented in that unfiltered left-join result.
Check assumptions and schema changes
Document rules the diagram doesn’t express, including value ranges, deletion behavior, and assumptions about recorded prices. Identify which rules require database constraints or application checks, and verify their implementation separately.
When identifiers or relationships change, compare the diagram with the data dictionary and deployed definitions. Review dependent joins, reports, and pipelines, then record the affected rules and required validation.
Diagram review checklist
- Identifier scope and permitted duplicates match the meaning of each modeled record.
- Every relationship’s endpoints match the written rules for both minimum and maximum participation.
- Join and aggregation choices count the intended objects and handle empty orders according to report requirements.
- The model’s documentation records omitted assumptions, required implementation checks, and dependencies affected by schema changes.
These checks complement broader database design principles covering normalization, constraint choices, and managing schema changes. Keep the review findings with the model so you can check future revisions against those decisions.
How an ER Diagram Relates to a Database Schema
An ER diagram can guide a relational implementation by making the intended entities, identifiers, and relationships explicit. Table definitions then specify the columns, types, and constraints that implement the chosen structure in a database.
Connect the model to table definitions
In this mapping, each row represents one customer, order, product, or order line, depending on its table. The diagram’s selected identifiers become the primary keys shown in this proposed relational mapping.
| Diagram entity | Corresponding table | Primary key |
|---|---|---|
| Customer | customers | customer_id |
| Order | orders | order_id |
| Product | products | product_id |
| OrderItem | order_items | (order_id, line_number) |
In this mapping, attributes become columns, and foreign-key definitions connect the corresponding tables through referenced keys. The database schema also specifies concrete column types, nullability, and supported constraints for the chosen database system.
Separate modeled rules from enforced constraints
An enforced foreign key from order_items.order_id to orders.order_id rejects non-null references to orders that don’t exist. An enforced composite primary key requires both order_id and line_number to be non-null in this example. Neither key requires an order to have lines, matching this model’s allowance for empty orders.
In Exasol, you can enable or disable primary-key and foreign-key constraints, so verify their deployed state. If you omit a constraint’s state, Exasol uses the session’s CONSTRAINT_STATE_DEFAULT setting when creating the constraint.
The separate Exasol SQL schema example demonstrates table definitions and constraint-state checks using three tables. It has no separate product table and records each order line’s item name in item_name.
Try Exasol Personal for Free
Run real workloads at full Exasol performance.
Frequently Asked Questions
No, an ERD models data structure, while a data flow diagram (DFD) models data moving through processes. An ERD can show entities, attributes, and relationships; a DFD can show processes, data stores, and external entities.
UML, or Unified Modeling Language, covers multiple diagram types for describing system structure and behavior. An ERD focuses on data entities and their relationships, with attributes included where appropriate to the modeling level. UML also includes activity and sequence diagrams for describing behavior and interactions within a system.
Define the business rules and scope, then choose the modeling level and notation appropriate to the task. Add entities, attributes, and identifiers appropriate to that level, then draw relationships with minimum and maximum participation. Validate the diagram against representative records and the business rules, revising any inconsistent identifiers or relationships.
Identify the notation and legend, then read the entity names, relevant attributes, and any displayed keys. Read relationships in both directions, interpreting any stated minimum and maximum participation limits according to the legend. Interpret line styles according to the stated convention, and check the relationships against the written business rules.