

ClickHouse Got Faster at Joins. The Optimizer Gap Didn’t Close.

ClickHouse 26.4 closed half the join gap in one release. On the queries that need a cost-based optimizer, Exasol is still up to 174× faster.
When we published our Exasol-vs-ClickHouse TPC-H comparison last November, the ClickHouse team responded the best way an engineering team can: they shipped code. ClickHouse 26.4 targets exactly the weakness that benchmark exposed, join performance, and the improvement is real. On our rerun, 26.4 beats its own 25.10 predecessor on 20 of 22 queries and is 3.3× faster on join-heavy workloads. Credit where it is due.
But faster joins are not the same thing as a cost-based optimizer. We reran the entire benchmark, ClickHouse 25.10.2.65 vs ClickHouse 26.4.4.38 vs Exasol 2026.1.0; on identical AWS hardware, at TPC-H scale factor 100, and published every number. The headline gap narrowed from roughly 10× to 5.8× median. On the queries that depend on subquery decorrelation and join-order optimization, the gap did not narrow at all. On Q21, Exasol is 173.7× faster and ClickHouse 26.4 is actually slower there than 25.10 was.
This is the difference between a faster execution engine and a smarter one.
What ClickHouse Improved in 26.4
ClickHouse 26.4 is a genuine step forward, and the gains are not evenly spread — they land precisely where the join work was done. Against 25.10, the new release improved on 20 of 22 queries and cut the system-wide median almost in half, from 2,850.3ms to 1,498.2ms.
The largest single-query improvements are all join-bound:
| Query | Name | 25.10 | 26.4 | 26.4 gain |
|---|---|---|---|---|
| Q05 | Local Supplier Volume | 12,833.6ms | 1,771.9ms | 7.2× |
| Q08 | National Market Share | 10,068.0ms | 1,621.3ms | 6.2× |
| Q17 | Small-Quantity-Order Revenue | 8,405.3ms | 1,489.2ms | 5.6× |
| Q07 | Volume Shipping | 5,390.3ms | 1,108.7ms | 4.9× |
| Q03 | Shipping Priority | 4,941.7ms | 1,400.8ms | 3.5× |
This is the payoff from ClickHouse’s new dynamic-filtering and join-runtime-filter machinery (use_top_k_dynamic_filtering, enable_join_runtime_filters, and related settings, all enabled for this run). By pushing filters onto the probe side of a join, ClickHouse cuts the number of rows that ever reach the hash table. On the multi-table joins where that matters most, the effect is substantial. Anyone still citing 25.10 numbers against ClickHouse is arguing against a release that is no longer current.
The improvement is real. The question is whether it closes the structural gap and here the answer is more interesting.
Where the Optimizer Gap Remains
Faster joins accelerate the queries that already produce reasonable join plans. They do nothing for the layer above the join operator: the cost-based optimizer that decides whether a query becomes a good plan in the first place. Rewriting a correlated subquery as an anti-join, decorrelating a NOT EXISTS, and choosing an efficient join order across eight tables are optimizer responsibilities, not execution-engine ones.
The clearest evidence is that on the two most optimizer-dependent queries in TPC-H, ClickHouse 26.4 did not merely fail to improve; it regressed relative to 25.10:
- Q21 (Suppliers Who Kept Orders Waiting): 57.8 seconds on 25.10, 76.7 seconds on 26.4.
- Q02 (Minimum Cost Supplier): 1,292.5ms on 25.10, 4,042.5ms on 26.4.
Both are correlated-subquery workloads. The join tuning that helped everywhere else made these slower, because the bottleneck was never join execution speed, it was the absence of a rewrite that turns the subquery into an efficient join in the first place. You cannot tune your way to an optimization pass that isn’t there.
Benchmark Configuration
Systems under test. Three database systems, benchmarked on identical hardware using their current stable releases:
- Exasol 2026.1.0 —> native c4 cluster manager installation; the majority of the 247.7GB system memory allocated to the database; analytical, cost-based join ordering; query cache disabled to measure actual execution performance.
- ClickHouse 26.4.4.38 —> native APT installation on Ubuntu; memory limit ≈230GB (≈93% of system memory), 32 max threads; the tuned join-runtime and dynamic-filtering optimizations enabled for this run; external group-by / sort thresholds at 100GB.
- ClickHouse 25.10.2.65 —> the prior stable release, configured identically to 26.4 except for the 26.4-specific optimization settings; the baseline our original benchmark measured.
Infrastructure. AWS r6id.8xlarge (memory-optimized, local NVMe): Intel Xeon Platinum 8375C @ 2.90GHz, 32 vCPUs, 247.7GB RAM, local NVMe SSD (no EBS network overhead), eu-west-1, Ubuntu 22.04 LTS.
Workload. TPC-H, all 22 queries (Q01–Q22), scale factor 100 (∼100GB across 8 tables; fits in memory on this instance, so the run is CPU / memory-bandwidth bound, not disk bound). 2 warmup runs (excluded) plus 15 measured runs per query; median reported; singleuser sequential execution.
Identical Hardware, and Why That Favors ClickHouse
Running a ∼100GB dataset on a 247.7GB instance looks generous, and it is, but the headroom is there for ClickHouse, not Exasol. We deliberately put all three systems on the same largememory hardware so the comparison would be apples-to-apples, with the machine eliminated as a variable. That decision quietly matters.
Exasol stores its columnar data compressed, so the ∼100GB of raw TPC-H data occupies substantially less than 100GB once loaded. A machine with well under 100GB of RAM would still hold the entire compressed working set in memory. And even that is a soft limit: Exasol treats RAM as a cache over NVMe-backed storage rather than a hard requirement, so it does not depend on the working set being fully memory-resident in the first place. Between compression and caching, it would return essentially the same query times on a fraction of this instance’s memory.
ClickHouse’s heavy queries do not have that latitude. The large multi-table joins and the correlated-subquery workloads, Q21 above all, rely on memory to hold hash tables and intermediate results. On a substantially smaller box they would spill to disk, slow sharply, or hit ClickHouse’s max_memory_usage ceiling and fail outright. The 247.7GB was provisioned so ClickHouse could finish the benchmark at all. Exasol did not need it.
Overall Performance Results
Across all 22 TPC-H queries, Exasol maintained a 5.8× faster median and a 16× faster average over the improved ClickHouse release:
| Metric | ClickHouse | ClickHouse 26.4 | ClickHouse 25.10 | Exasol vs 26.4 |
|---|---|---|---|---|
| Median | 256.6 ms | 1,498.2 ms | 2,850.3 ms | 5.8× |
| Average | 319.3 ms | 5,110.8 ms | 6,723.7 ms | 16.0× |
| Minimum | 27.3 ms | 145.4 ms | 217.6 ms | 5.3× |
| Maximum | 1,022.9 ms | 76,654.9 ms | 57,752.3 ms | 74.9× |
The average-to-median spread tells the story. Exasol’s average (319.3 ms) sits close to its median (256.6 ms); performance is tight and predictable. ClickHouse 26.4’s average (5,110.8 ms) is more than 3× its median, dragged up by optimizer-bound queries, above all Q21 at 76.7 seconds, with Q18, Q09, and Q02 each in the multi-second range.
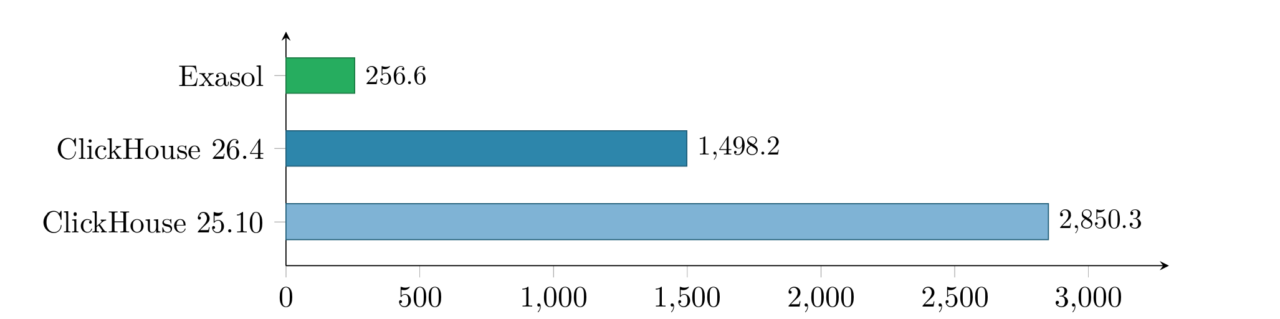
Consistency. Exasol’s runtime ranges from 27.3ms to 1,022.9ms (a 37× spread); ClickHouse 26.4 ranges from 145.4ms to 76,654.9ms (a 527× spread). Exasol’s slowest query in the entire suite completes in about one second; ClickHouse 26.4’s slowest takes 76.7 seconds. For production analytics under an SLA, that worst-case behavior, not the median, is what determines whether a dashboard feels reliable.
By query category. Grouping the 22 queries by analytical pattern shows where 26.4’s gains landed, and where Exasol’s lead is widest:
| Category | Exasol | CH 26.4 | CH 25.10 | Exasol vs 26.4 | 26.4 vs 25.10 |
|---|---|---|---|---|---|
| Aggregation | 87.8ms | 457.1ms | 617.9ms | 5.2× | 1.35× |
| Complex Analytical | 354.8ms | 1,489.2ms | 5,390.3ms | 4.2× | 3.62× |
| Join-Heavy | 189.2ms | 2,066.2ms | 6,762.7ms | 10.9× | 3.27× |
Category definitions match our original November benchmark: Aggregation = Q01, Q06, Q12, Q14, Q15, Q19, Q20; Complex Analytical = Q03, Q04, Q07, Q13, Q16, Q17, Q18; Join-Heavy = Q02, Q05, Q08, Q09, Q10, Q11, Q21, Q22.
The pattern is telling. ClickHouse 26.4 improved most on the Join-Heavy and Complex Analytical categories (3.27× and 3.62× over 25.10), precisely where the join work applies. Yet Join-Heavy remains the category where Exasol’s advantage is largest (10.9×). ClickHouse in vested in joins and still fell furthest behind on them, because those queries are dominated by the correlated-subquery cases the optimizer never restructures.
Query-Level Performance Analysis
Where Exasol’s lead persists, ordered by margin. The chart shows Exasol’s speedup over the tuned ClickHouse 26.4 on the standout queries:
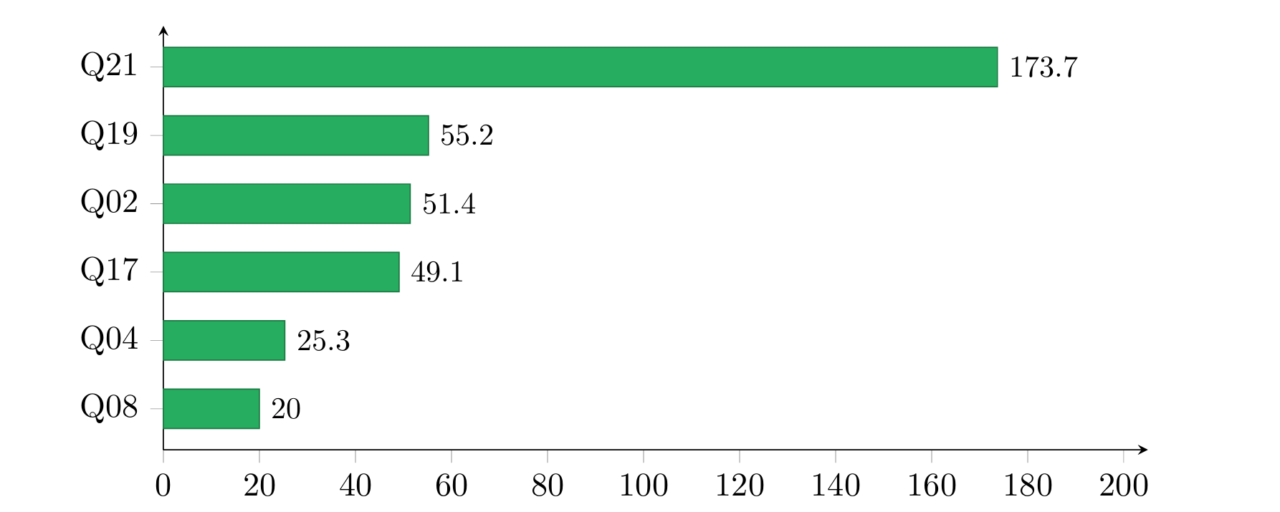
Q21 —> Suppliers Who Kept Orders Waiting (173.7× faster). Exasol 441.2ms | Click
House 26.4 76,654.9ms (76.7 s) | ClickHouse 25.10 57,752.3ms. Q21 uses correlated EXISTS and NOT EXISTS subqueries across four tables to find suppliers who were the sole late shipper on a waiting order. Exasol decorrelates both subqueries into anti-joins and finishes in under half a second. ClickHouse materializes and re-evaluates the correlated predicate, and 26.4’s additional join machinery makes it slower than 25.10 rather than faster. This single query is the entire thesis: join speed was never the constraint.
Q02 —> Minimum Cost Supplier (51.4× faster). Exasol 78.6ms | ClickHouse 26.4
4,042.5ms | ClickHouse 25.10 1,292.5ms. A correlated subquery selecting the minimum-cost supplier per part. Like Q21, this regressed in 26.4 (from 1.3s to 4.0s), confirming the pattern is structural rather than incidental.
Q19 —> Discounted Revenue(55.2×faster). Exasol27.3ms|ClickHouse 26.41,507.3ms. Complex OR predicates across multiple columns. Exasol’s predicate pushdown collapses the scanned volume; ClickHouse evaluates the disjunction far less efficiently.
Q17 —> Small-Quantity-Order Revenue (49.1× faster). Exasol 30.3ms | ClickHouse
26.4 1,489.2ms. Notably, this is one of 26.4’s biggest improvements over 25.10 (5.6× faster). ClickHouse closed most of the gap here — and Exasol is still 49× ahead, because the correlated aggregation subquery still is not fully decorrelated.
Q08 —> National Market Share (20.0× faster). Exasol 81.0ms | ClickHouse 26.4
1,621.3ms. An eight-table join. ClickHouse’s join improvements cut this from 10.1s to 1.6s — real progress — yet Exasol’s cost-based join ordering still finishes it in 81ms.
Q08 and Q17 are the honest counterweight to Q21: they show ClickHouse’s join work paying off, cutting their runtimes from roughly ten seconds to around 1.5 seconds, while Exasol’s optimizer still keeps it 20× to 49× ahead.
What the Numbers Say About Engine Design
Read together, the results describe two different kinds of engineering. ClickHouse invested in the execution layer, vectorized joins, runtime filters, dynamic filtering and it paid off exactly where you would predict: on queries that already had a workable plan and simply needed to run faster. That is genuine, valuable work, and it halved the headline gap.
The cost-based optimizer is a different discipline: subquery decorrelation, anti-join rewrites, and join-order search across normalized schemas. It is a decade of a separate kind of investment, and it is the layer that determines whether a hard query is even solvable in interactive time. That layer is where Exasol’s advantage lives, and it is why the structural gap held steady while the execution gap narrowed. A faster execution engine helps the queries you can already plan well. A better optimizer changes which queries are possible at all.
The same architectural difference shows up in the hardware bill. Because Exasol does not depend on the dataset fitting in memory, it would post these numbers on a far smaller machine than ClickHouse needs merely to complete the run. The generous RAM in this benchmark exists for ClickHouse’s benefit. A smarter engine tends to ask for less iron, not more.
The Audited Scoreboard
A fair objection to any vendor benchmark is that it runs on the vendor’s own harness. Our numbers above are fully reproducible, but they are not independently audited, so here is the part that is. As of June 2026, a Dell PowerEdge R7715 running Exasol holds the number-one TPC-H result at the 1TB scale, on a single, non-clustered server:
| Rank | System (TPC-H, 1TB) | QphH@1TB | $/kQphH 1 |
|---|---|---|---|
| 1 | Dell PowerEdge R7715 + Exasol | 5,489,326 | 25.01 |
| 2 | HPE + Microsoft SQL Server 2022 | 1,531,016 | 192.37 |
| 3 | HPE + Microsoft SQL Server 2022 | 1,257,628 | 233.57 |
That is a 3.6× lead in throughput over the next audited system, at 25.01 vs 192.37 USD per kQphH; 7.7× better price-performance. Exasol takes the top single-server result at 3TB as well, again with the best price-performance in its class. These are independently audited results under TPC’s full-disclosure rules, not a blog rerun, and you can read the Exasol/Dell disclosures directly on the official TPC-H results page. ClickHouse, for its part, has never submitted an official TPC-H result at any scale.
The efficiency angle is the one worth sitting with. This is a single compact server outrunning clustered and big-iron configurations on price-performance, the same “more with less hard ware” property from the memory discussion above, now measured by an outside auditor rather than by us. A fuller write-up of the official results follows separately.
Conclusion
ClickHouse 26.4 earned its improvements. It is a materially faster release than 25.10, especially on joins, and the median gap to Exasol shrank from roughly 10× to 5.8×. That is progress worth acknowledging plainly.
It also leaves the fundamental picture intact. Exasol still delivers a 5.8× faster median, 16× faster average, and a 75× more predictable worst case, and it remains 173.7× faster on the single query that most depends on the optimizer; a query where ClickHouse’s newest release moved backward. Faster hash joins narrowed the headline. They did not close the optimizer gap, because that gap was never about join speed.
Resources and Full Results
The complete three-system benchmark, every query, all 15 measurements per query, full configurations, and the raw timings, is published on the public Benchkit leaderboard for independent verification: exasol.github.io/benchkit/public → the Comparisons box → Exasol vs ClickHouse 2026 (SF100).
The report includes interactive per-query tables, box plots, heatmaps, and CDF charts, along with complete hardware and software specifications. We ran the same three-way comparison at scale factor 30, and it shows the same pattern with the gap scaling as expected.
The harness is public. Change the hardware, change the scale factor, add your own queries, and run it yourself. If a future ClickHouse release closes the optimizer gap the way 26.4 closed the join gap, we will rerun it and report that just as plainly.
Appendix: FullPer-QueryMedians(SF100)
All 22 TPC H queries, median milliseconds. Green cells mark the fastest system for that query.
| Query | Exasol | CH26.4 | CH25.10 | Exa/26.4 | 26.4/25.10 |
|---|---|---|---|---|---|
| Q01 | 809.4 | 2,522.3 | 2,798.0 | 3.1× | 1.11× |
| Q02 | 78.6 | 4,042.5 | 1,292.5 | 51.4× | 0.32× |
| Q03 | 354.8 | 1,400.8 | 4,941.7 | 3.9× | 3.53× |
| Q04 | 62.4 | 1,580.8 | 2,632.7 | 25.3× | 1.67× |
| Q05 | 221.9 | 1,771.9 | 12,833.6 | 8.0× | 7.24× |
| Q06 | 43.0 | 145.4 | 217.6 | 3.4× | 1.50× |
| Q07 | 291.3 | 1,108.7 | 5,390.3 | 3.8× | 4.86× |
| Q08 | 81.0 | 1,621.3 | 10,068.0 | 20.0× | 6.21× |
| Q09 | 1,022.9 | 5,223.4 | 17,520.0 | 5.1× | 3.35× |
| Q10 | 590.9 | 2,360.4 | 3,457.4 | 4.0× | 1.46× |
| Q11 | 156.5 | 436.8 | 675.8 | 2.8× | 1.55× |
| Q12 | 86.2 | 802.1 | 851.9 | 9.3× | 1.06× |
| Q13 | 697.1 | 2,107.8 | 5,880.4 | 3.0× | 2.79× |
| Q14 | 87.8 | 202.1 | 263.3 | 2.3× | 1.30× |
| Q15 | 391.4 | 320.6 | 394.8 | 0.8× | 1.23× |
| Q16 | 471.8 | 422.7 | 524.6 | 0.9× | 1.24× |
| Q17 | 30.3 | 1,489.2 | 8,405.3 | 49.1× | 5.64× |
| Q18 | 661.9 | 5,577.8 | 7,670.3 | 8.4× | 1.38× |
| Q19 | 27.3 | 1,507.3 | 2,902.6 | 55.2× | 1.93× |
| Q20 | 324.2 | 457.1 | 617.9 | 1.4× | 1.35× |
| Q21 | 441.2 | 76,654.9 | 57,752.3 | 173.7× | 0.75× |
| Q22 | 92.2 | 682.4 | 830.7 | 7.4× | 1.22× |
| Median | 256.6 | 1,498.2 | 2,850.3 | 5.8× | 1.90× |
All benchmark results, configurations, and raw data are available for independent verification at the link above. Conducted using standard TPC-H methodology on identical AWS infrastructure.