
Data Warehouse Schemas: Star, Snowflake, and Galaxy Explained

A data warehouse schema defines how data is structured, organized, and connected inside a data warehouse. It provides a logical blueprint for how fact tables and dimension tables relate to each other, enabling analytical queries to run efficiently and consistently across large datasets.
A data warehouse schema is the arrangement of tables, keys, and relationships used to model analytical data. It builds on broader data warehouse concepts that define how analytical systems structure and manage information. At its core, it determines:
- How facts (measurable business events) are stored
- How dimensions (descriptive attributes) are defined
- How users and BI tools navigate the data
Schemas allow analysts to join tables predictably, aggregate metrics, and run cross-functional reports without needing deep knowledge of the underlying storage.
Why Schema Design Matters for Analytics Performance
Schema choice has a direct impact on:
- Query performance: The number of joins, table shapes, and key relationships influence how fast queries run.
- Concurrency: Some schemas handle multi-user workloads better due to simpler join paths.
- Storage efficiency: Normalized vs. denormalized structures affect table size and compression.
- Governance & lineage: Clean, predictable structures simplify auditing, quality checks, and data ownership models.
- BI tool behavior: Tools like Power BI, Tableau, and Looker assume specific modeling patterns; a well-designed schema reduces ambiguity and modeling errors.
Because analytical workloads involve scanning large volumes of data, a schema that minimizes unnecessary joins and clarifies relationships can significantly reduce execution time and resource consumption.
Where Schemas Fit in Modern Data Architectures
Schemas remain foundational even as architectures evolve:
- In a traditional data warehouse, schemas define the core dimensional model used for reporting and analytics. Moreover, they operate as one layer within larger data warehouse architecture, which governs how data is collected, transformed, stored, and exposed to downstream tools.
- In cloud data warehouses, schemas still govern performance, optimizations, and storage behavior; even when compute and storage scale independently.
- In lakehouse architectures, schemas define curated layers (e.g., gold/semantic layers) that BI tools read from, ensuring consistent and governed analytics.
- In hybrid or on-prem environments, schema predictability becomes even more critical, especially when dealing with limited resources or high concurrency.
Regardless of the platform, a well-designed schema acts as the semantic contract between raw data and analytical workflows.
The Three Main Data Warehouse Schema Types
Data warehouse schemas fall into three primary categories: Star, Snowflake, and Galaxy (Fact Constellation), following general practices of dimensional modeling used widely in analytics and BI. Each defines a different way to model facts and dimensions, balancing simplicity, performance, storage efficiency, and modeling flexibility.
Why These Three Schema Types Matter
Each schema type reflects different modeling needs:
- Star Schema → Simplest design, best for fast queries and BI dashboards.
- Snowflake Schema → Normalized dimensions, ideal for complex hierarchies.
- Galaxy Schema → Multiple fact tables sharing dimensions, best for large or multi-domain data warehouses.
Understanding these types helps data teams choose the right structure for their analytics workflows, optimize performance, and reduce long-term maintenance costs.
Quick Comparison Table
| Schema Type | Normalization | Complexity | Query Speed | Best For |
|---|---|---|---|---|
| Star | Low (denormalized) | Simple | Fast | Dashboards, high concurrency |
| Snowflake | Medium–High | Moderate | Slower (more joins) | Hierarchical data, storage efficiency |
| Galaxy | Mixed | High | Varies | Multi-domain analytics, multiple fact tables |
When to Use Which Schema
A simple decision guide:
- Choose Star Schema when performance and simplicity matter most.
- Choose Snowflake Schema when modeling detailed hierarchies or optimizing storage.
- Choose Galaxy Schema for enterprise-scale models with multiple related fact tables.
These decisions sit within a broader family of data warehouse models, which apply different modeling patterns depending on business requirements, data volume, and governance expectations.
Schema choice isn’t just a modeling decision, it determines how fast teams can turn questions into answers. In high-concurrency environments, schema clarity is as critical as engine performance.
Dirk Beerbohm, Global Partner Solution Architect, Exasol
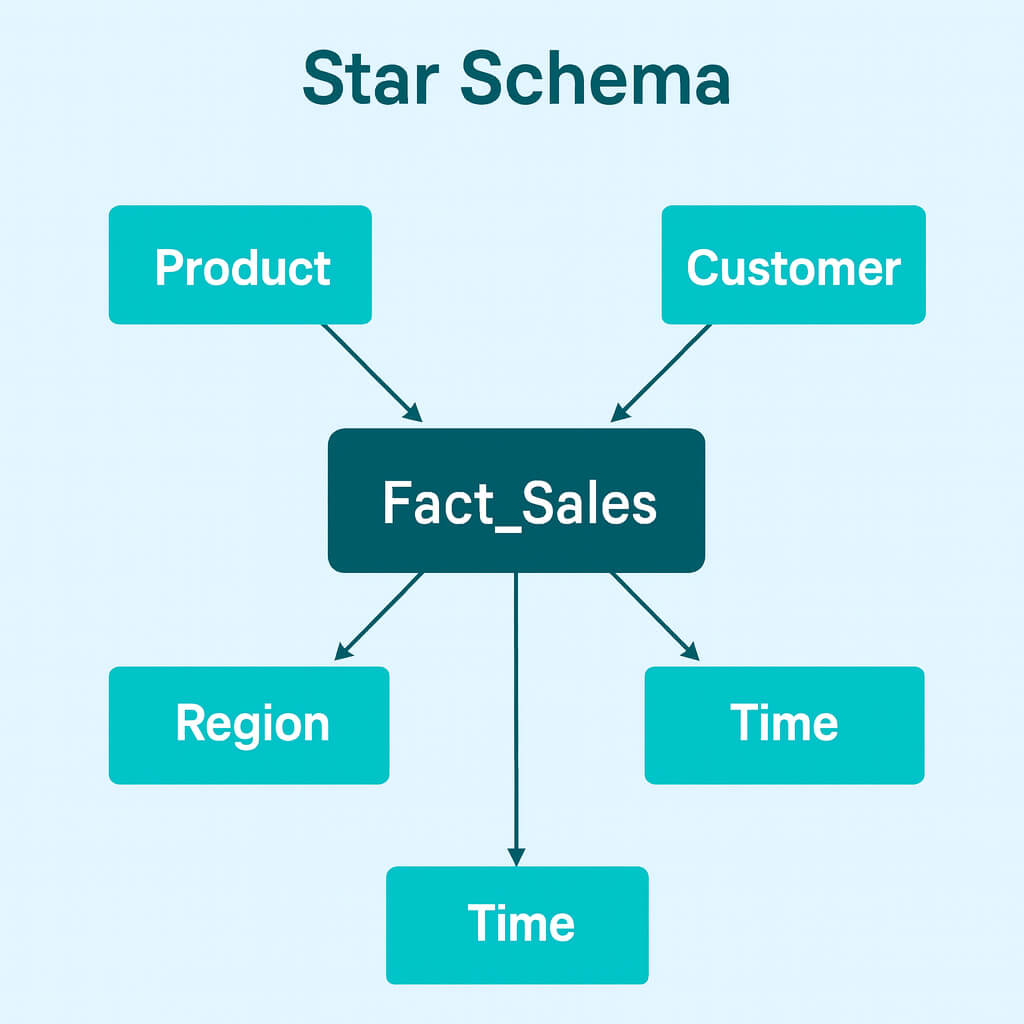
Star Schema
The Star Schema is the simplest and most widely used data warehouse schema. It organizes data into a central fact table surrounded by multiple dimension tables, creating a structure that visually resembles a star. Because of its straightforward joins and denormalized dimensions, it remains the preferred model for BI tools, dashboard workloads, and high-concurrency analytical environments.
Definition & Components
A Star Schema consists of:
- Fact Table: Contains quantitative measures (e.g., sales amount, page views, transactions) and foreign keys referencing dimensions.
- Dimension Tables: Contain descriptive attributes such as customer details, product categories, time periods, or locations.
- Primary–Foreign Key Relationships: Each dimension table joins directly to the fact table, with no intermediate tables or hierarchical layers.
This design reduces join complexity and clarifies how users can navigate metrics across different business dimensions.
Advantages
The Star Schema is chosen for its strong analytical performance and operational simplicity:
- Fast query performance: Minimal joins allow analytical engines to scan data efficiently, especially under high demand.
- Straightforward modeling: Business users, BI teams, and analysts can easily understand and query the structure.
- Predictable behavior in BI tools: Tools like Power BI, Tableau, and Looker map cleanly onto star-shaped dimensional models.
- High concurrency: Engines optimized for parallelism benefit from denormalized dimensions, reducing contention and join overhead.
For workloads requiring rapid dashboard refreshes or frequent interactive queries, the Star Schema offers the most frictionless experience.
Disadvantages
The simplicity of the Star Schema comes with some trade-offs:
- Higher redundancy: Denormalized dimension tables repeat data (e.g., shared hierarchies or attributes), increasing storage usage.
- Limited flexibility for complex hierarchies: If dimensions contain multi-level or nested relationships, the model becomes harder to maintain.
- Potential maintenance cost: Updating denormalized data requires careful ETL/ELT design to ensure consistency across repeated fields.
These limitations become more visible in very large or highly hierarchical datasets.
When to Choose a Star Schema
A Star Schema is ideal when:
- Performance and simplicity are the primary goals.
- Query volume is high, particularly with many concurrent users.
- Dimensions don’t require deep hierarchies, or those hierarchies can be flattened cleanly.
- BI dashboards drive most analytical activity.
- The organization favors fast development and easy maintenance over normalized storage.
It is also the most suitable model when analytical workloads rely heavily on aggregations, filters, and drill-downs across predictable dimensional attributes.
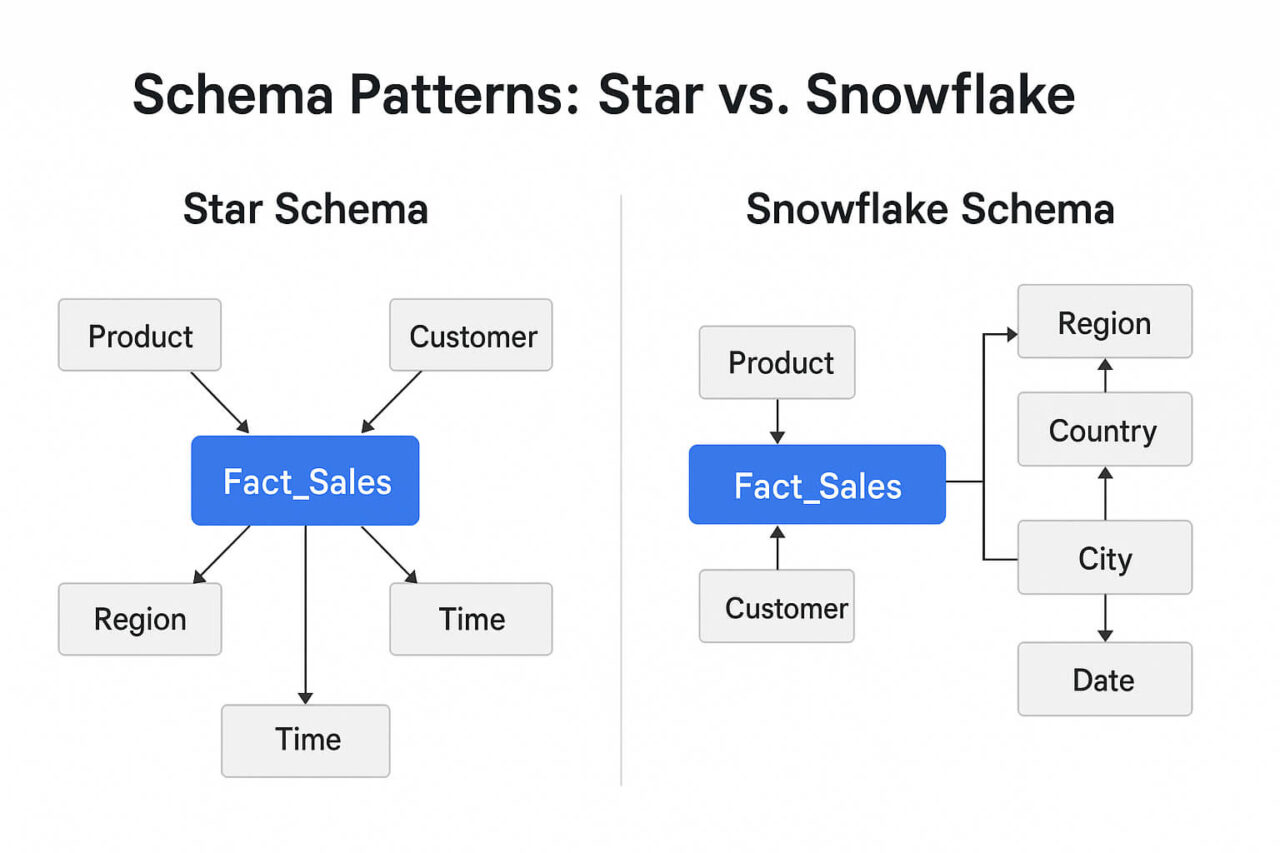
Snowflake Schema
The Snowflake Schema extends the Star Schema by normalizing dimension tables into multiple related tables. Instead of storing all dimension attributes in a single table, attributes are organized into separate, linked sub-dimensions. This creates a structure resembling a snowflake, with multiple branching layers extending from each dimension.
While slightly more complex, the Snowflake Schema offers advantages in storage optimization and hierarchical modeling, especially in large or multi-level datasets.
Definition & Structure
A Snowflake Schema modifies the Star Schema by introducing:
- Normalized dimensions split into multiple tables (e.g., Product → Product, Category, Department).
- Additional primary–foreign key relationships inside each dimension branch.
- A fact table that still remains central, but dimensions connect through multiple lookup tables rather than a single denormalized table.
This normalization reduces redundancy but introduces more joins.
Advantages
The Snowflake Schema is preferred when data relationships require deeper structure:
- Reduced redundancy & storage efficiency
Normalization eliminates repeated values in dimension tables (e.g., repeating categories in every product row). - More accurate modeling of real hierarchies
Useful for industries with multi-level taxonomies (e.g., retail, finance, supply chain). - Improved data integrity
Updating attributes (e.g., a category name) requires changes in only one table. - Can improve query performance in selective queries
Engines can filter on smaller lookup tables before joining to the fact table.
Disadvantages
The additional normalization introduces complexity:
- More joins → potentially slower performance
Especially in engines optimized for denormalized structures or star-shaped models. - Higher query complexity for BI teams
Analysts may need to navigate multiple layers to access attributes. - More complex ETL/ELT pipelines
Particularly when loading or updating multi-level hierarchies. - Reduced readability
Snowflake Schemas are harder to visualize and understand at a glance compared to Star Schemas.
These challenges are why many analytics teams still prefer the Star Schema unless hierarchy depth makes normalization necessary.
When Snowflake Schemas Outperform Star Schemas
Choose a Snowflake Schema when:
- Dimension tables contain large hierarchies with many repeating values.
- There is a need to reduce dimension table size to optimize storage or compression.
- Data governance requires strict normalization for regulatory or audit purposes.
- You model high-cardinality attributes where deduplication reduces dataset size significantly.
- Hierarchies change frequently and must be updated in a single location rather than across multiple denormalized tables.
In cloud data warehouses or engines with strong join optimization, Snowflake Schemas can offer good performance with lower storage cost, though empirical testing is always required.
Galaxy Schema (Fact Constellation)
The Galaxy Schema, also known as a Fact Constellation Schema, extends dimensional modeling to support multiple fact tables that share one or more dimension tables. This structure is designed for complex, multi-domain analytics environments where different business processes (such as sales, inventory, marketing, or logistics) must be analyzed both independently and together.
Because it supports mixed levels of granularity, shared dimensions, and cross-functional analysis, the Galaxy Schema is considered the most flexible (but also the most complex) of the three primary data warehouse schema types.
Definition
A Galaxy Schema consists of:
- Multiple fact tables that represent different business processes
- Shared dimensions that connect these processes (e.g., Date, Product, Customer)
- Optional process-specific dimensions for capturing attributes unique to one fact table
- Multiple possible paths for analysis, including cross-fact comparisons
Example: A retail data warehouse may include:
- Fact_Sales
- Fact_Inventory
- Fact_Shipments
Each of these fact tables might share dimensions like Product, Store, and Date, while maintaining their own process-specific dimensions (e.g., Supplier, Warehouse).
This structure resembles a constellation: multiple stars connected through shared components.
Advantages
The Galaxy Schema provides benefits in large, enterprise, or multi-subject-area analytics environments:
- Supports multiple business processes in one unified model
Teams can analyze related metrics across different domains (e.g., sales vs. inventory vs. returns). - Shared dimensions eliminate duplication
A single Product or Date dimension is reused across fact tables, improving consistency. - Highly flexible for cross-functional analysis
Enables queries like:
“How do inventory drops correlate with sales spikes across product categories?” - Scales well for enterprise-level analytics
Especially when subject areas are tightly interconnected. - Reduces maintenance of overlapping dimensional data
Governance becomes easier when dimensions are standardized.
Disadvantages
The flexibility of the Galaxy Schema introduces several challenges:
- Higher modeling complexity
Understanding relationships across multiple fact tables requires careful design and clear documentation. - More demanding ETL/ELT pipelines
Ensuring consistent grain, keys, and dimension relationships across processes increases development effort. - Greater query complexity
Analysts may need to navigate multiple fact tables and determine the correct join paths. - Potential performance trade-offs
Cross-fact queries can increase join depth and table scans, depending on engine optimization and fact table size. - Strong governance required
Without consistent definitions (e.g., “What is a product?”), shared dimensions can drift across teams.
These factors make the Galaxy Schema best suited for mature analytics environments with multi-domain requirements.
Best Use Cases
Choose a Galaxy Schema when:
- The organization operates across multiple subject areas that need unified reporting.
- Several fact tables share common dimensions (e.g., shared customers, products, dates).
- You must support mixed-grain facts (daily sales, weekly shipments, hourly inventory updates).
- Cross-functional analysis is a priority (e.g., sales vs. supply chain performance).
- An enterprise data warehouse needs a single modeling layer that scales across teams and workloads.
Industries where Galaxy Schemas are especially common include retail, e-commerce, logistics, telecommunications, and large-scale financial services.
Star vs. Snowflake vs. Galaxy: Detailed Comparison
Data teams rarely select a schema type in isolation. Each model (Star, Snowflake, and Galaxy) reflects a different set of trade-offs between performance, maintainability, storage efficiency, and analytical complexity. All three originate from established dimensional modeling practices used in analytical systems.
Understanding these differences helps teams choose the right approach for each analytical workload.
Star schemas shine for dashboards and high-volume BI queries. Snowflake schemas help with complex hierarchies. But in multi-domain analytics, a constellation model offers consistency across teams.
Florian Wenzel, VP of Product, Exasol
Feature Comparison Table
A consolidated overview of how the three schema types differ:
| Feature | Star Schema | Snowflake Schema | Galaxy Schema |
|---|---|---|---|
| Normalization | Low (denormalized) | Medium–High | Mixed (shared + normalized dims) |
| Query Performance | Fast (fewer joins) | Moderate to slow (more joins) | Varies by fact table size & join depth |
| Complexity | Low | Medium | High |
| Storage Use | Higher (redundant data) | Lower (deduplicated dims) | Mixed (shared dims reduce duplication) |
| Modeling Flexibility | Limited for deep hierarchies | Strong hierarchical modeling | Supports multiple domains & grains |
| Best For | Dashboards, high concurrency, ad hoc BI | Hierarchical data, storage optimization | Enterprise-wide analytics, multi-process models |
Performance Considerations (Where Engines Behave Differently)
Real-world performance is nuanced. Several engine-level factors influence how each schema behaves:
Star Schema Performance
- Fewer joins → lower CPU cost
- Ideal for engines optimized for denormalized analytical scans
- Performs best with high concurrency due to predictable join paths
Snowflake Schema Performance
- Tight, normalized hierarchies can speed up selective filters
- Dimension lookups reduce scanned data when attributes are large or high-cardinality
- More joins increase planning time and may impact execution on engines not optimized for normalization
Galaxy Schema Performance
Varies widely depending on:
- Fact table size differences
- Grain mismatch (daily vs hourly facts)
- Whether shared dimensions introduce join contention
- How the engine manages parallel joins across multiple branches
Galaxy schemas require more careful query tuning, especially in shared-dimension scenarios where filters propagate across facts.
Maintenance & Governance Comparison
Star Schema
- Easy to maintain
- Updates to hierarchies require modifying denormalized tables
- Most suitable when business logic changes infrequently
Snowflake Schema
- Centralized updates to lookup tables improve governance
- Dimension drift is easier to detect and correct
- ETL pipelines must handle more keys and relationships
Galaxy Schema
- Governance is critical due to shared dimensions
- Requires consistent definitions across the organization (“What is a product?”)
- Higher modeling discipline needed to prevent semantic drift
Which Schema Should You Choose?
Choose Star Schema if:
- Speed and simplicity are top priorities
- BI teams need intuitive tables
- Analytical queries are aggregation-heavy
- You support many concurrent dashboard users
Choose Snowflake Schema if:
- You work with complex, multi-level hierarchies
- Reducing duplication or storage is important
- You manage high-cardinality dimensions
- Data governance standards require normalization
Choose Galaxy Schema if:
- You manage multiple business processes
- Fact tables share common dimensions
- You require cross-functional analysis
- Your data warehouse spans multiple domains or teams
Choosing the Right Schema for Your Data Warehouse
Selecting the appropriate schema type is not a theoretical exercise; it’s a data warehouse design decision that directly affects performance, maintainability, and the long-term usability of your analytics environment. The right choice depends on business workflows, data characteristics, governance requirements, and how users interact with the data warehouse.
This section provides a structured approach for deciding between Star, Snowflake, and Galaxy schemas.
Key Decision Criteria
Query Patterns
Aggregation-heavy dashboards → Star
Selective, attribute-level filtering on deep hierarchies → Snowflake
Cross-process analysis (sales + inventory + logistics) → Galaxy
Data Volume & Grain
Low-to-medium volume; consistent grain → Star
Large dimensions with repeated values → Snowflake
Multiple grains across fact tables (hourly + daily + weekly) → Galaxy
Hierarchical Complexity
Simple hierarchies (Category → Product) → Star
Nested or multi-level hierarchies → Snowflake
Multiple hierarchies shared across domains → Galaxy
Concurrency Requirements
High concurrency + low-latency BI workloads → Star
Moderate concurrency + mixed workloads → Snowflake
Enterprise-scale concurrency across teams → Galaxy
Governance & Auditability
Less formal governance, rapid iteration → Star
Strict versioning, attribute control → Snowflake
Centralized governance across business units → Galaxy
ETL/ELT Pipeline Design
Simpler pipelines → Star
Normalized pipelines with SCD handling → Snowflake
Multiple ingestion paths feeding multiple facts → Galaxy
Practical Decision Tree
Use this quick guide to determine the best schema type:
Step 1: Do multiple business processes share dimensions?
Yes → Consider Galaxy Schema
No → Continue
Step 2: Do your dimensions contain multi-level or nested hierarchies?
Yes → Snowflake Schema
No → Continue
Step 3: Is performance for BI dashboards and high concurrency critical?
Yes → Star Schema
No → Continue
Step 4: Are you optimizing for storage efficiency or governance?
Yes → Snowflake Schema
No → Star Schema
This simple flow reflects real-world modeling trade-offs and helps teams avoid over-modeling or under-modeling their data.
Hybrid Schema Designs
Many modern data warehouses blend techniques from all three schemas rather than adhering strictly to one model.
Hybrid Star–Snowflake
- Core dimensions remain denormalized (Star)
- Complex hierarchies split into sub-dimensions (Snowflake)
- Often used when only a few dimensions require normalization
Hybrid Galaxy–Snowflake
- Multiple fact tables share normalized dimensions
- Useful for enterprise data warehouses with strict governance needs
Star Schema with Minimal Normalization
- A pragmatic middle ground to reduce redundancy while keeping joins simple
Lakehouse or Semantic Layer Considerations
- Even in lakehouse architectures, curated “gold” tables often follow Star or Galaxy patterns
- Semantic layers (e.g., Exasol Semantic Layer, LookML, dbt metrics) frequently assume a star-like structure
Hybrid patterns acknowledge that schema design is not binary; it depends on balancing performance, clarity, and long-term evolution.
Modern Architecture Considerations
While Star, Snowflake, and Galaxy schemas originated in traditional data warehousing, they remain foundational even as architectures evolve toward cloud-native, hybrid, and lakehouse designs. The role of schemas has expanded from simply shaping tables to influencing how data is modeled, governed, optimized, and exposed across diverse analytical ecosystems.
Cloud platforms changed storage economics, but they didn’t change the need for well-modeled data. Even in lakehouses and semantic layers, dimensional principles remain the backbone of reliable analytics.
Alexander Stigsen, Chief Product Officer, Exasol
Schemas in Cloud Data Warehouses
Cloud data warehouses (such as Snowflake and BigQuery) separate compute and storage, while others like Redshift (depending on node type) and Exasol use tightly integrated compute–storage architectures optimized for high-performance analytical workloads.
Performance is no longer solely about storage layout
- Star Schemas still deliver the fastest joins because of their simplicity.
- Snowflake Schemas may benefit from columnar pruning and micro-partitioning.
- Galaxy Schemas depend on how well the engine parallelizes joins across multiple fact tables.
Cost considerations also change the equation
- Normalizing large dimensions can reduce scan cost.
- Denormalized structures may lead to higher storage or compute cost depending on query patterns.
Concurrency amplifies the advantages of clean models
Star Schemas often outperform others in multi-user workloads, since engines can execute shorter plans more predictably.
Schemas in Lakehouse Architectures
Lakehouse platforms combine data lakes with data warehouse-like ACID tables. Schemas play a different role here:
Curated zones still require schema design
Even if raw data remains schema-on-read, curated tables (e.g., gold layer) almost always adopt:
- Star Schemas for BI consumption
- Snowflake Schemas for hierarchical reporting
- Galaxy Schemas for multi-domain modeling
Schema evolution becomes more important
Lakehouses support schema modification over time, meaning:
- Hierarchies can grow
- Dimensions can split
- Fact tables can expand to additional grains
Models must be flexible enough to adapt to data that arrives earlier, faster, or in more varied forms than in traditional ETL pipelines.
Semantic layers assume star-like structures
Tools like dbt, Looker, and semantic modeling services expect stable dimensions and fact tables to define metrics cleanly.
Handling Real-Time and Streaming Workloads
With increasing adoption of streaming sources (Kafka, Pulsar, Kinesis), data warehouses ingest data incrementally throughout the day.
Schema design shifts accordingly:
Fact tables may receive mixed-grain updates
- Real-time events (e.g., orders created)
- Batch aggregates (e.g., daily shipments)
Galaxy Schemas often work best when grains differ across processes.
Dimensions require late-arriving support
Streaming pipelines must handle:
- Late-arriving dimension keys
- Slowly changing dimensions (SCDs)
- Out-of-order event timestamps
Snowflake Schemas provide better maintainability for rapidly changing hierarchies.
Query engines must optimize for new patterns
Real-time BI dashboards benefit from:
- Star Schemas for fast refresh
- Materialized views for denormalized aggregates
- Vectorization and join hints for complex Snowflake/Galaxy joins
Schemas in AI, ML, and Feature Engineering Workloads
As organizations operationalize machine learning, schema decisions now influence feature stores and model training pipelines:
Wide tables (denormalized) are common in ML
Feature engineering often benefits from Star-like structures that flatten:
- Customer attributes
- Product attributes
- Time-based features
Snowflake Schemas support feature lineage
Normalized structures help track:
- Feature definitions
- Update cycles
- Attribute-level governance
Galaxy Schemas support multi-process input for ML
For example:
- Sales fact
- Marketing fact
- Inventory fact
These can feed unified predictive models without duplicating dimensions.
AI-ready architectures increasingly rely on clean schema modeling to keep features consistent and auditable across production and experimentation.
Real-World Examples and Patterns
Customer stories from organizations using Exasol provide insight into how high-performance analytical systems behave in real environments. While these case studies do not disclose specific schema designs (Star, Snowflake, or Galaxy), they do show how a well-structured, modern data warehouse and high-performance engine impact data loading, reporting, and analytics workflows.
Digital Planet (eCommerce)
Digital Planet is a South African eCommerce solutions provider that needed a faster, more reliable analytics environment capable of supporting decision-making across their organization.
What They Achieved
- Improved data load times by 1,400% (from ~30 minutes to ~2 minutes per hour).
- Achieved 100% data availability, even under unstable infrastructure conditions.
- Enabled self-service reporting for business users.
- Saved 36 hours per month in reporting effort.
- Scaled cost-effectively on Azure cloud infrastructure.
Why This Example Matters
Digital Planet shows how performance improvements in a data warehouse directly impact business efficiency, availability of insights, and the adoption of self-service analytics.
bank99 (Financial Services)
bank99 AG built a centralized BI and reporting platform to support rapid decision-making, daily operations, and regulatory requirements.
What They Achieved
- Reduced daily data loading from six hours to under ten minutes.
- Gained near–real-time access to consolidated financial data.
- Increased agility by supporting new reporting needs quickly.
- Unified data from multiple systems into one analytical environment.
Why This Example Matters
bank99 illustrates how load-time optimization and centralization amplify the strategic value of analytics in regulated, data-intensive industries.
Spread Group (Global E-Commerce & Manufacturing)
Spread Group transitioned from MySQL and Pentaho to Exasol to address performance limitations in their reporting and analytics workflows.
What They Achieved
- Improved dashboard and report performance by up to 164×.
- Enabled ~50 power users across departments to run self-service analyses.
- Eliminated the need for manual query tuning.
- Built a scalable analytics environment for global operations.
Why This Example Matters
This case demonstrates how high-performance analytics unlock self-service at scale, reduce operational bottlenecks, and accelerate decision-making in fast-moving businesses.
Wissenschaftsstadt Darmstadt (Smart City Analytics)
The city of Darmstadt in Germany needed real-time insights from traffic, environmental, and sensor data to support smart-city initiatives and public services.
What They Achieved
- Automated ingestion, analysis, and reporting for high-volume IoT data.
- Replaced slow, manual data preparation with near real-time dashboards.
- Improved accessibility and timeliness of environmental intelligence for stakeholders.
Why This Example Matters
This example shows how a fast analytical engine enables real-time operational decision-making: critical for municipal services, traffic control, and environmental monitoring.
Patterns Across These Examples
Across industries (retail, eCommerce, finance, manufacturing, and public-sector analytics) consistent themes appear:
- Faster data movement enables faster decisions
- Self-service adoption increases when performance barriers disappear
- Centralization improves consistency and reduces reporting effort
- Timely data unlocks operational and real-time use cases
These outcomes support the broader principles in this article: a well-designed data warehouse, combined with an optimized engine, amplifies the value of data across an organization.
Common Mistakes in Schema Design
Even experienced data teams encounter challenges when designing schemas for analytical workloads. These mistakes typically lead to performance issues, inconsistent reporting, increased maintenance costs, or difficulty scaling the data warehouse. Avoiding the following pitfalls helps ensure that your data warehouse remains efficient, reliable, and easy to evolve.
Over-Normalizing Dimensions
Normalizing dimensions too aggressively is one of the most common modeling mistakes. Symptoms include:
- Excessive branching of dimension tables
- Deep join paths
- Hard-to-understand models for BI users
While normalization reduces redundancy, pushing it too far increases query complexity and slows performance, especially in engines optimized for denormalized analytic workloads.
When in doubt, flatten dimension attributes that are frequently queried together.
Creating Unnecessary Snowflakes
Some teams “snowflake” dimensions by default, even when hierarchies are simple.
This leads to:
- More joins than necessary
- Harder query debugging
- Unintuitive navigation for analysts
Snowflaking should be used only when the hierarchy genuinely requires multiple levels or offers a meaningful storage, governance, or update benefit.
Misaligned Grain in Fact Tables
A fact table must represent events at a consistent grain.
Common problems include:
- Mixing daily and hourly events in the same fact
- Combining transactional and aggregated data
- Using dimension keys that don’t match the fact’s granularity
These issues lead to duplicate counting, incorrect aggregations, and confusing joins. Always define grain first; design dimensions second.
Ignoring Slowly Changing Dimensions (SCDs)
Many data warehouses fail because historical changes to attributes (e.g., customer address, product category) are not tracked correctly.
Mistakes include:
- Storing only the most recent attribute value
- Not versioning records
- Overwriting historical data during ETL
Without proper SCD handling (Type 1, 2, or hybrid approaches), time-based reporting becomes unreliable and auditability suffers.
Inconsistent Dimension Definitions Across Teams
As organizations scale, dimension definitions (e.g., “customer,” “product,” “region”) must remain consistent.
Mistakes include:
- Multiple versions of the same dimension
- Conflicting attribute definitions
- Divergent key usage across fact tables
This is especially harmful in Galaxy (constellation) schemas, where shared dimensions ensure cross-domain consistency.
Centralizing dimension governance prevents semantic drift.
Not Designing for Expected Query Patterns
Schema design that ignores query workloads often leads to bottlenecks.
Examples:
- Storing frequently filtered attributes in deep sub-dimensions
- Placing high-cardinality attributes far from the fact table
- Denormalizing rarely used attributes into fact tables unnecessarily
A good schema begins with how users will query the data, not with theoretical normalization goals.
Forgetting About Concurrency
Schemas that perform well in isolation may degrade under load if not designed for concurrency.
Challenges include:
- Too many joins on popular dashboard queries
- High-cardinality joins stressed under many simultaneous users
- Non-optimal dimension placement for frequently accessed filters
Star Schemas typically perform best for concurrency, but all schema types must be evaluated under expected user loads.
Designing Without Growth in Mind
A schema that works for 1 million rows may fail at 1 billion.
Common mistakes:
- Choosing schema types based only on current data volume
- Hardcoding assumptions about hierarchies that later expand
- Ignoring schema evolution patterns in lakehouse or cloud environments
Model for today, but structure your data warehouse for tomorrow.
How to Think About Schema Design in Modern Data Warehousing
Schema design remains one of the most influential decisions in any analytical system. Whether you choose a Star, Snowflake, or Galaxy structure, the schema defines how data is organized, how efficiently queries run, and how easily teams can build reliable insights.
While modern architectures (cloud data warehouses, lakehouses, semantic layers, streaming pipelines) offer new flexibility, they do not eliminate the need for clear, intentional modeling. In practice, the fastest and most scalable analytical environments still rely on well-defined schemas that reflect business processes, hierarchies, and reporting needs.
Across industries, the most successful data teams share a common pattern: they model data with clarity, maintain consistent dimensions, and choose schema structures that fit their query patterns and governance requirements. High-performance engines amplify the impact of these choices, enabling faster reporting, broader self-service adoption, and more timely decision-making.
Schema design is not about following a rigid template. It is about selecting the structure that best aligns with your data, your users, and your long-term analytics strategy. By understanding the strengths and trade-offs of each schema type, and by grounding your model in real workload requirements, you create a foundation that can evolve with your organization and support the full lifecycle of modern analytics.
Frequently Asked Questions
The Star Schema is the most popular data warehouse schema.
It uses a central fact table linked to multiple dimension tables, making it simple to understand, easy for BI tools to use, and fast for analytical queries.
The three primary data warehouse schemas are:
Star Schema
Snowflake Schema
Galaxy (Fact Constellation) Schema
These structures organize fact and dimension tables differently depending on hierarchy depth, performance needs, and analytical complexity.
A schema is the logical structure that defines how data is organized in a database or warehouse, including tables, relationships, keys, and constraints. A table is a storage object within a schema that holds rows and columns of data.
Common data warehouse architectures include:
Single-tier architecture
Two-tier architecture
Three-tier architecture
Data mart architecture
Data lakehouse / hybrid architecture
Each architecture organizes storage, compute, and access layers differently based on scalability and analytical needs.
A Star Schema is a dimensional model with one central fact table connected directly to multiple denormalized dimension tables. It is optimized for fast queries, high concurrency, and easy navigation in BI tools.
Data warehouses use Star, Snowflake, or Galaxy schemas depending on the complexity of hierarchies, performance goals, and how many business processes need to be modeled.
The Star Schema is an OLAP modeling technique. It is designed for analytical workloads, not for transaction processing systems.
Yes. The Star Schema remains relevant because BI tools, semantic layers, and analytical engines still rely on predictable, denormalized structures for fast and intuitive querying. Even in cloud and lakehouse environments, curated analytical layers commonly use star-like models.
In general database modeling (beyond data warehousing), common schema types include:
Logical schema
Physical schema
Conceptual schema
In analytical systems, the main schema types are Star, Snowflake, and Galaxy.