

One Server. 7.7x better Price/Performance. Exasol Changes the Economics of Enterprise Analytics.

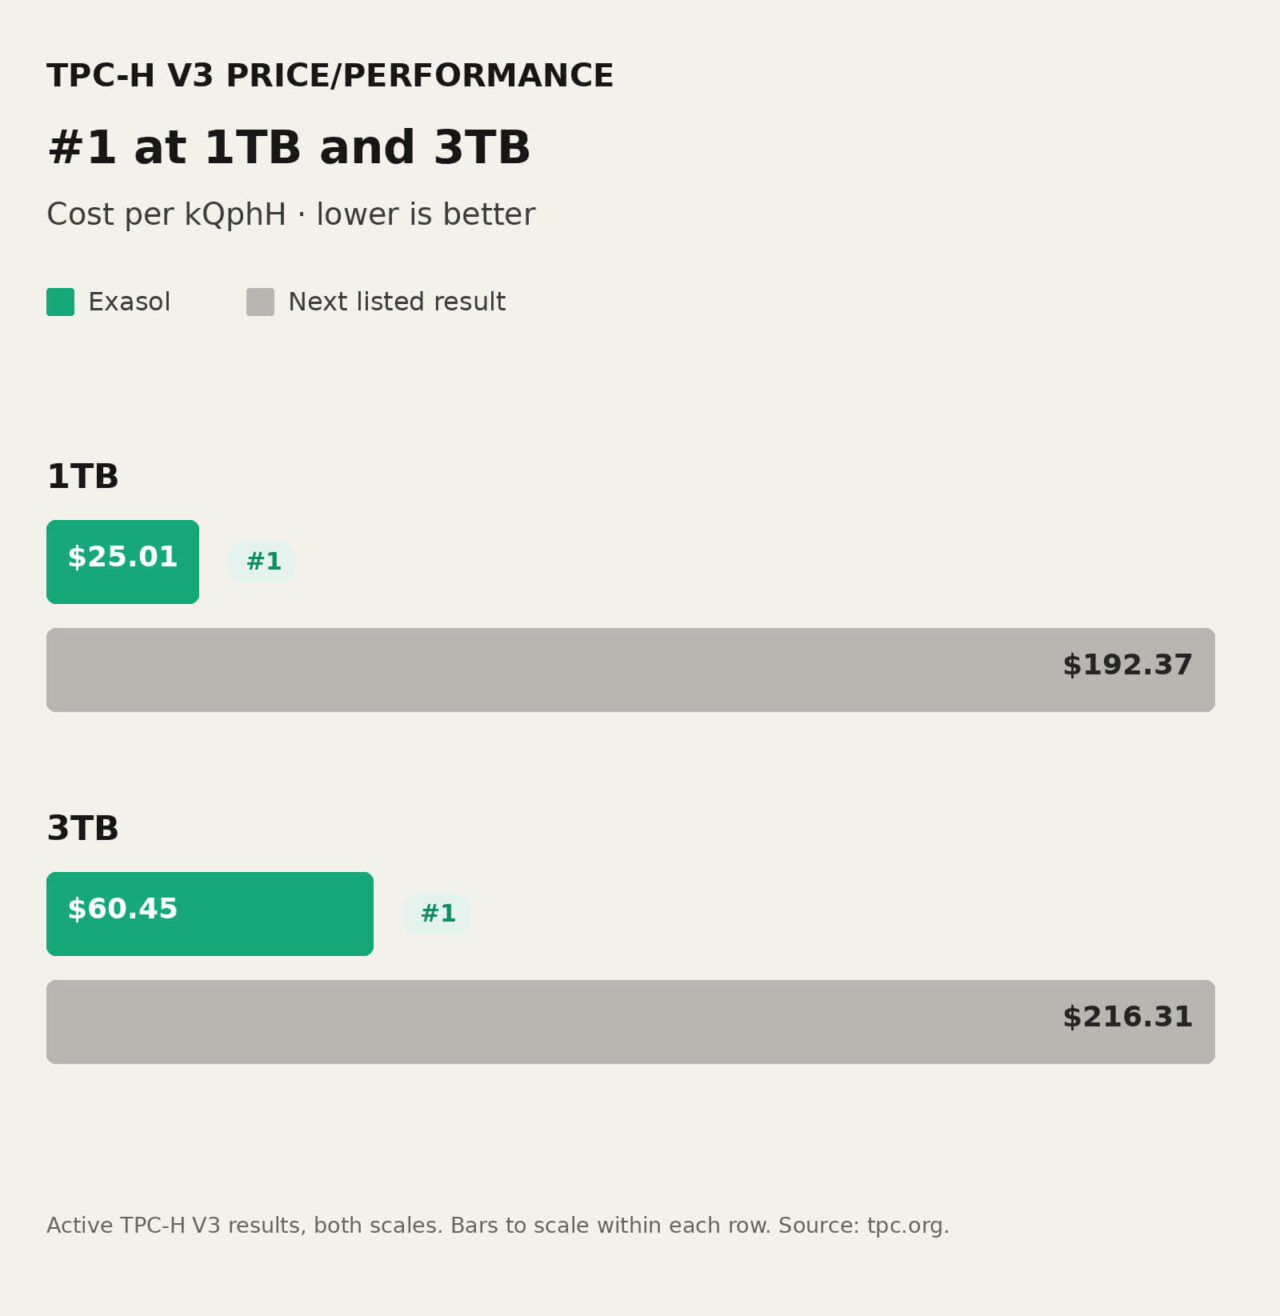
Exasol is #1 in active TPC-H V3 performance and price/performance for a single-server system at both the 1TB and 3TB scales. One Dell PowerEdge R7715, one AMD EPYC processor, no cluster. At 1TB, Exasol delivers the benchmark’s workload at a 7.7x price/performance advantage over the next-best system. The results were independently audited by a TPC-certified auditor and published by the Transaction Processing Performance Council, which ranks cluster and non-cluster systems in separate categories.
| Scale | Exasol $/kQphH | Next-best active USD-priced result | Advantage |
|---|---|---|---|
| 1 TB | $25.01 | $192.37 | 7.7x |
| 3 TB | $60.45 | $216.31 | 3.6x |
Source: TPC-H V3 active results, tpc.org, 23rd of June, 2026. The TPC ranks cluster and non-cluster systems separately and lists price/performance by pricing currency; dollar comparisons shown are against USD-priced results.
Why lead with price/performance rather than raw speed? Because the question enterprises ask of a data platform is shifting. As AI and analytics workloads grow, raw speed alone matters less; performance per dollar, infrastructure simplicity, and predictable total cost of ownership matter more. Speed you can always buy by stacking nodes and growing the bill. The harder question, the one your finance team lives, with is what that performance costs.
The usual objection to a price/performance win is: “Sure, but what did they give up in speed?” In this case, nothing. At 1TB, Exasol delivers both: leading price/performance and roughly 3.6x the throughput of the next-best result.
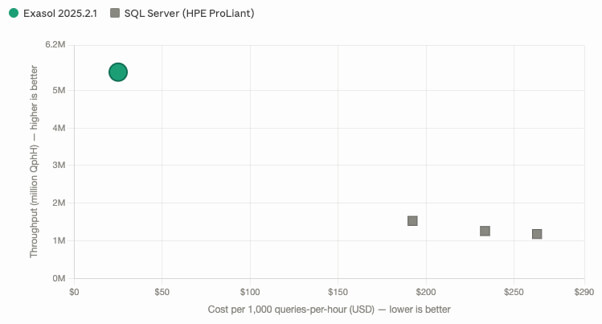
Up and to the left is better, lower cost per unit of performance, higher throughput. Exasol is the only result in that corner. Source: TPC-H V3, 1TB, tpc.org.
That’s the point of price/performance as a metric. Raw throughput on its own is a hardware budget in disguise; you can buy a big number by stacking nodes. Dividing performance by what you paid for it is where efficiency shows up and where the economics actually change for the customer.
One Server. Not a Cluster.
These results were produced on a single Dell PowerEdge R7715 running Exasol 2025.2.1. One server. One AMD EPYC processor. No cluster. The hardware is excellent but the reason a single node leads the field is the efficiency of the engine running on it.
The TPC’s leaderboards make the distinction themselves: cluster and non-cluster systems are ranked in separate categories, because they represent different answers to the same question. The newest cluster entry at 3TB illustrates the contrast well. It posts higher raw throughput than our result, produced by a 22-node cloud deployment with more than 1,000 vCPUs and over 4TB of RAM, holding the entire dataset in memory with room to spare, priced as multi-year cloud subscriptions in CNY. That is a legitimate way to buy throughput. It is also exactly the trade this post is about: performance through accumulation, or performance through efficiency. One server running Exasol leads every active single-server result on the board, at both scales on a fraction of the infrastructure the cluster entries deploy.
Debunking the Memory-cost Myth
There’s a widespread assumption that fast analytics means holding all your data in memory and that the bill scales with the RAM. It’s why “in-memory” has become shorthand for “expensive.”
Exasol breaks that link. The engine works intelligently across memory and storage: hot data stays in memory and is compressed hard, while the engine reads from disk when a workload calls for it. So performance isn’t hostage to fitting everything in RAM, and cost doesn’t balloon with the dataset. That’s a large part of why a single server delivers this level of price/performance, where others reach for more nodes and more memory.
No benchmark is your workload. TPC-H is a decision-support benchmark, and the benchmark configuration reflects the TPC-H test, not a sizing template for production.
The engine behind these results is the same one you can run yourself. Exasol Personal, a free single-user local edition, lets you experience that single-node speed first-hand on your own machine. The price/performance figures above describe our full enterprise platform; Personal is simply the most direct way to feel the engine that earns them.
A Like-for-like Measurement
The listed comparison systems are enterprise servers running the established commercial database stack: same benchmark, same scale factors, same published rules, same price/performance metric. The gap isn’t a few percent. It’s multiples.
No benchmark is your workload. TPC-H is a decision-support benchmark, not a carbon copy of production. But as controlled, independently audited evidence, it’s a useful signal of how much analytical work a platform delivers per dollar.
The Question Worth Asking
We focus on price/performance because it shows up where it matters, your infrastructure bill, not just a benchmark table. Leading analytics performance shouldn’t require ever-growing infrastructure to match.
So we’re curious: what does a unit of analytical work cost you today?
See the full audited results on tpc.org, then try the engine yourself with Exasol Personal.