Database Benchmarks Lie (If You Let Them)

Traditional database benchmarks focus on throughput and latency – how many queries per second can be processed, how execution time changes as hardware resources increase. This benchmark revealed something different: reliability under realistic conditions is the first scalability constraint.
We set out to compare Exasol and ClickHouse across three scaling dimensions: available memory, concurrent users, and cluster size. The dataset was modest by analytical standards – roughly 30 GB of TPC-H data. The implicit assumption was that resource-related failures would be unlikely at this scale. That assumption turned out to be wrong.
What we discovered fundamentally changed how we think about scalability. A system that executes queries quickly under idealized conditions but fails deterministically at moderate concurrency is not scalable in a practical sense. Benchmarks that ignore query failures can easily tell a story that reality will later contradict.
1. The Task: Evaluating Scalability Beyond Single-Query Performance
The task was to build a scalability benchmark comparing Exasol and ClickHouse. The goal was to understand how both systems behave as load and resource availability change – specifically along the dimensions that matter most for analytical platforms: available memory, number of concurrent users, and cluster size.
At first glance, this sounded like a routine exercise. Analytical database benchmarks tend to follow a well-established pattern: select a standard workload such as TPC-H, vary hardware parameters, measure runtimes, and derive conclusions about scalability from changes in average execution time.
There was also an implicit expectation going into this work. The dataset size was roughly 30 GB, corresponding to TPC-H scale factor 30. For a mature and widely adopted analytical database system, this is not a large dataset by any reasonable standard. One would normally assume that such a data volume should be comfortably handled on a single machine, even under moderate concurrency, and certainly on systems with significantly more memory than the dataset itself.
In other words, before running a single query, the assumption was that resource-related failures would be unlikely. Thirty gigabytes of data should not be pushing fundamental limits for a production-grade analytical engine. If problems were to appear, they would be expected at much larger scale factors or under extreme concurrency, not at this level.
The results told a different story.
2. The Test Setup: A Deliberately Conservative Methodology
Workload
The benchmark used the TPC-H workload at scale factor 30, corresponding to approximately 30 GB of data. The workload consists of 22 analytical queries characterized by complex join graphs, large aggregations, correlated subqueries, and non-trivial intermediate result sizes. From a data engineering perspective, this represents a fairly typical decision-support workload rather than a synthetic stress test.
Hardware
All tests were executed on AWS r6id instances, chosen for their predictable CPU-to-memory ratios and local NVMe storage. Memory configurations ranged from 16 GB to 128 GB, with CPU cores scaling proportionally from 2 to 16 vCPUs. Importantly, several configurations provided substantially more RAM than the dataset size itself – in some cases more than four times the uncompressed data volume.
| Instance | vCPUs | RAM | NVMe Storage |
|---|---|---|---|
| r6id.large | 2 | 16 GB | 118 GB |
| r6id.xlarge | 4 | 32 GB | 237 GB |
| r6id.2xlarge | 8 | 64 GB | 474 GB |
| r6id.4xlarge | 16 | 128 GB | 950 GB |
Software Versions
- Exasol 2025.1.8
- ClickHouse 25.10.2.65
Methodology
For each configuration, all 22 TPC-H queries were executed five times, resulting in 110 executions per test point. Query order was randomized using a fixed seed to ensure repeatability while avoiding systematic bias due to execution order. Concurrency was introduced by running multiple independent query streams in parallel, with configurations ranging from 5 to 20 concurrent users.
Three scaling dimensions were evaluated independently:
- Vertical memory scaling on a single node
- Concurrency scaling on a fixed high-memory node
- Horizontal scaling using small clusters with fixed per-node memory
Two metrics were tracked explicitly: average query runtime and query success rate. Average runtimes were computed only for queries that completed successfully on both systems, ensuring that failed queries were not silently excluded from the comparison.
3. The Results: When Expectations Collide with Reality
Memory Scaling
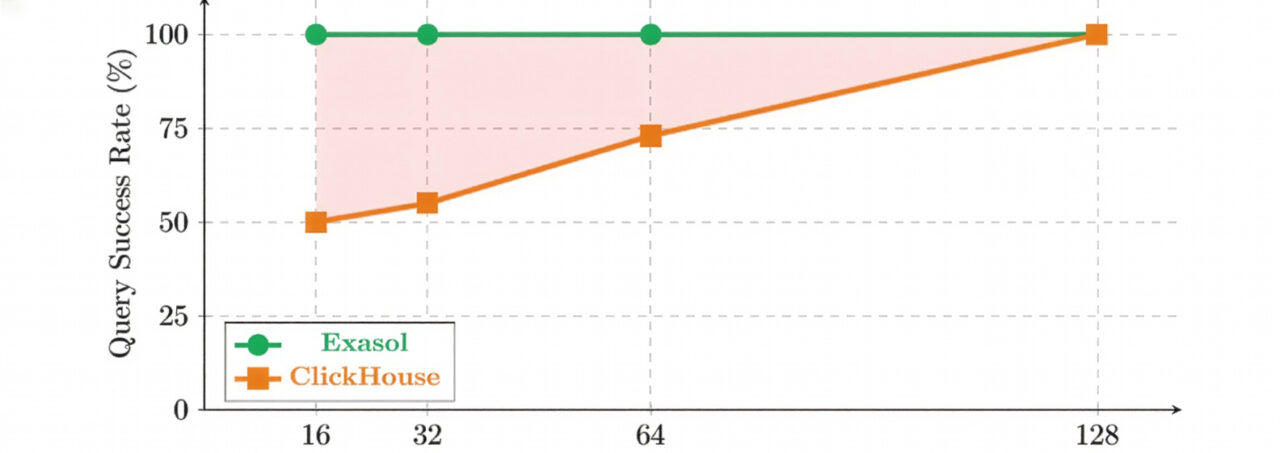
The memory-scaling experiments were conducted with a single user – no concurrency – to isolate the effect of available RAM on query execution. Even in this idealized scenario, the results immediately contradicted expectations.
ClickHouse exhibited surprising behavior. At 16 GB of RAM, only about half of the queries completed successfully. Eleven out of 22 queries failed consistently with out-of-memory errors. Increasing memory to 32 GB and 64 GB reduced the number of failures, but even at 64 GB – more than double the dataset size – approximately 27 percent of queries still failed. Only at 128 GB of RAM, more than four times the uncompressed data volume, did ClickHouse achieve a 100 percent query success rate.
Exasol, by contrast, executed all 22 TPC-H queries successfully starting at 16 GB of RAM and maintained a 100 percent success rate across all memory configurations. As memory and CPU cores increased, query runtimes decreased steadily, as one would expect from vertical scaling.
| RAM | vCPUs | Exasol Success | Exasol Avg Time* | ClickHouse Success | ClickHouse Avg Time* |
|---|---|---|---|---|---|
| 16 GB | 2 | 100% | 6,084 ms | 50% | 21,878 ms |
| 32 GB | 4 | 100% | 2,784 ms | 55% | 12,328 ms |
| 64 GB | 8 | 100% | 1,318 ms | 73% | 11,686 ms |
| 128GB | 16 | 100% | 750 ms | 100% | 10,500 ms |
*Fair comparison: average for queries that succeed on both systems.
Concurrency Scaling
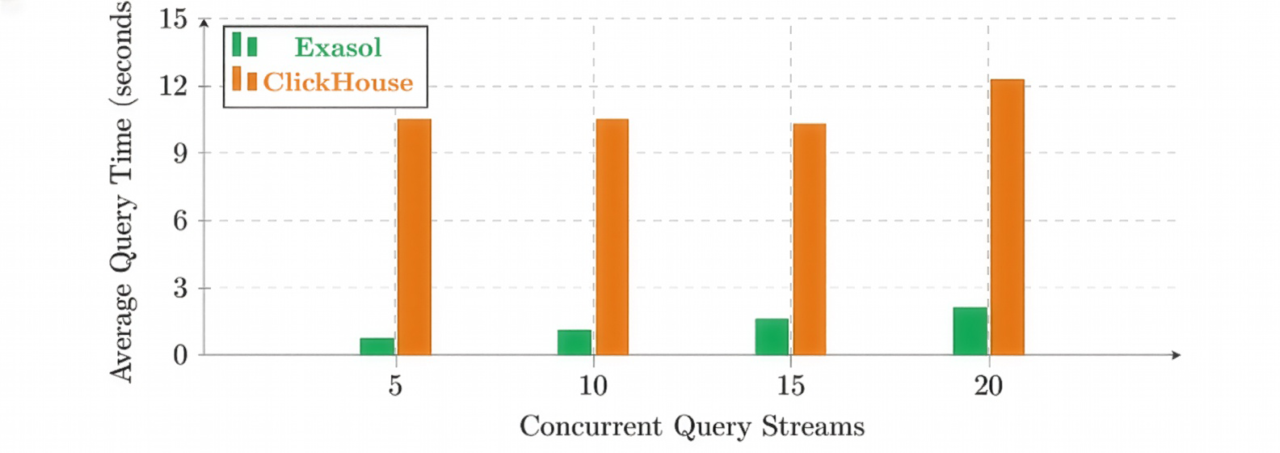
The concurrency experiments reinforced this surprise. With 128 GB of RAM, ClickHouse could execute all queries successfully at five concurrent users. At ten concurrent users, query success dropped to 73 percent. At fifteen users, it dropped further to 55 percent and remained there as concurrency increased. These were not extreme concurrency levels by analytical standards.
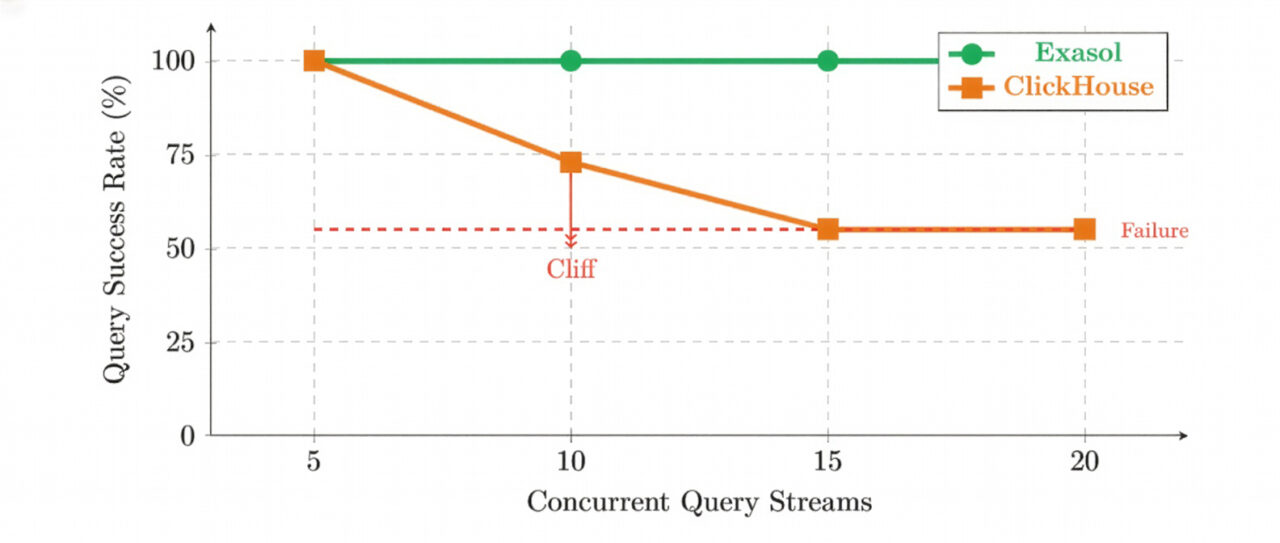
These failures were deterministic. The same complex, join-heavy queries failed across runs. The system did not degrade gracefully by becoming slower; instead, it crossed a threshold beyond which certain queries could no longer be executed at all.
Horizontal Scaling
Horizontal scaling did not change this outcome. Increasing the cluster size from one to four nodes increased total available memory from 32 GB to 128 GB, yet query success rates remained unchanged. While runtimes for successful queries improved slightly, the same subset of queries continued to fail.
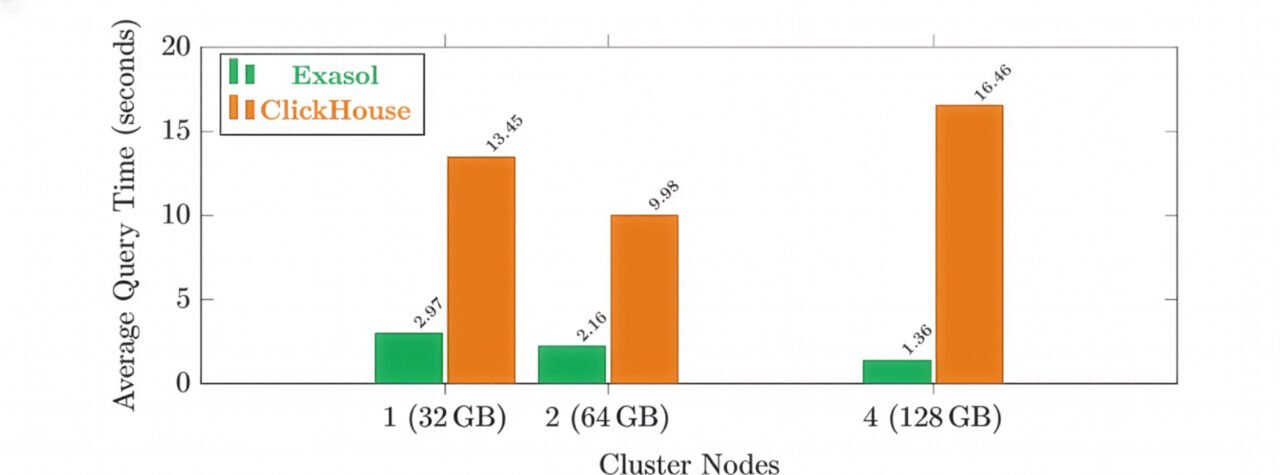
| Nodes | Total RAM | Exasol Success | Exasol Avg Time* | ClickHouse Success | ClickHouse Avg Time* |
|---|---|---|---|---|---|
| 1 | 32 GB | 100% | 2,971 ms | 55% | 13,451 ms |
| 2 | 64 GB | 100% | 2,158 ms | 55% | 9,978 ms |
| 4 | 128 GB | 100% | 1,357 ms | 55% | 16,455 ms |
*Average for queries that succeed on both systems.
The root cause was not total memory availability, but memory allocation at the query level. As concurrency increased, the effective memory budget per query decreased. Once this budget fell below a critical threshold, complex queries with large intermediate results exceeded their per-query limits regardless of total cluster resources.
4. The Learnings: Redefining Scalability for Analytical Workloads
This benchmark fundamentally changed how I think about scalability in analytical systems. Traditional scalability discussions tend to focus on throughput and latency – how many queries per second can be processed or how execution time changes as hardware resources increase.
What this benchmark highlighted is that reliability under realistic conditions is the first scalability constraint. A system that executes queries quickly under idealized conditions but fails deterministically at moderate concurrency is not scalable in a practical sense.
For data engineers, this distinction matters. Analytical platforms are rarely used by a single user in isolation. They serve dashboards, scheduled jobs, ad-hoc exploration, and batch processes concurrently. Query planners and execution engines must therefore cope not only with large intermediate results, but also with contention and memory pressure introduced by concurrent execution.
Benchmarks that restrict evaluation to single-user scenarios or that ignore query failures systematically underestimate these challenges. By focusing exclusively on average runtimes, they fail to distinguish between queries that run fast and queries that run at all.
After running this benchmark, I stopped treating scalability as a question of performance curves and started treating it as a question of execution guarantees. The relevant question is no longer how fast a query runs on an idle system, but which queries a system can reliably execute under realistic concurrency and memory pressure.
Benchmarks do not always lie. But without explicitly accounting for reliability and execution behavior under load, they can easily tell a story that reality will later contradict.
Benchmark data and reproduction scripts available at: https://exasol.github.io/benchkit/scalability/