

Can an AI Turn an Exasol Query Into a Dashboard?

How dash-server takes an agent from SQL to a running Dash application
From SQL to Something People Can Use
An engineer wants to see query volume, execution time, and failed queries over the past day. An AI assistant can help write the SQL. The result still needs an interface people can open, filter, and revisit.
The SQL can answer the immediate question. A usable dashboard needs more. Someone has to decide how to present the metrics, add filters and interactions, connect those controls back to the queries, package the result as an application, and give users somewhere to open it. If the question changes, that application has to change too.
The challenge is turning a data question into an application people can use and refine.
dash-server extends that workflow from query generation to application generation.
From Query to Application
dash-server exposes application-development operations to an AI assistant over MCP. With an Exasol connection profile configured, the assistant can use those operations to create a Dash application whose queries run against Exasol.
The result is a Python/Dash application that can be validated, previewed, revised, and deployed
Following One Dashboard Through the Workflow
Follow one request through the workflow: “Show query workload over the last 24 hours, with failed queries highlighted.”
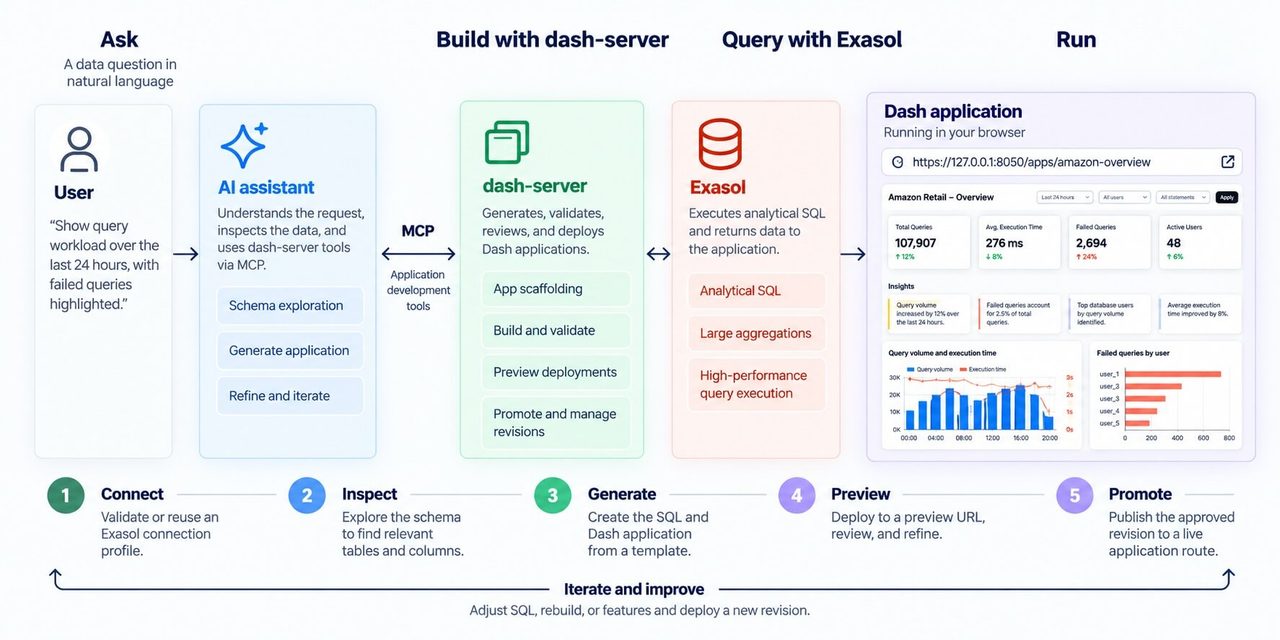
- Connect to Exasol. The agent validates or reuses a configured connection profile.
- Inspect the data. The agent introspects the schema to identify which tables and columns can answer the question. That schema information can provide the basis for a starting application scaffold.
- Generate the application. The agent writes the SQL and produces the Dash structure, including the layout, queries, and callbacks, from a template designed for Exasol-backed applications.
- Preview and refine. The app is deployed to a preview URL for review. The agent can adjust the SQL or UI, validate the revision, and redeploy the preview.
For example, the first preview might show query volume and execution time by hour. The engineer asks, “Add a filter for database users and show failed queries as a separate chart.” The agent updates the SQL and Dash layout, validates the new revision, and redeploys the preview for another review.
- Promote the revision. Once reviewed, the approved revision is promoted to its live application route, giving the engineer a browser URL to open.
Once promoted, the result is a browser-based Dash application backed by Exasol. The example below shows another analytics dashboard created through dash-server, with filters, KPIs, insights, and interactive visualizations.
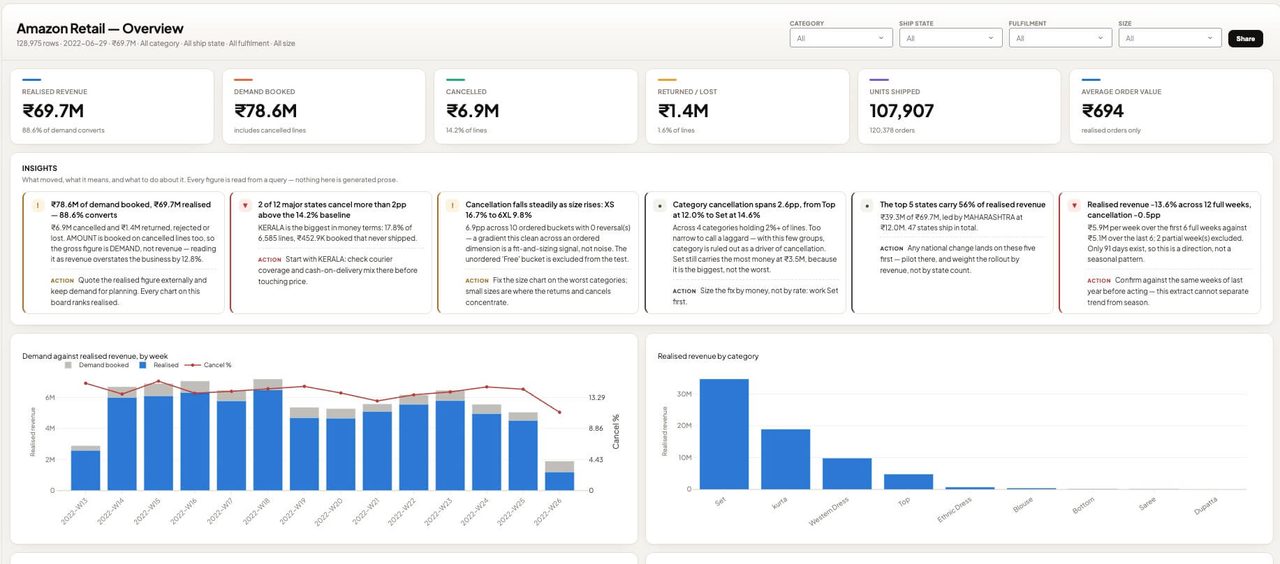
Caption: Example analytics dashboard created through dash-server and backed by Exasol.
What The Generated App Contains
The generated application includes Dash/Plotly source code, Exasol connection handling, SQL queries, and application dependencies. The starting template can be adapted to the available schema and the user’s question.
How Profiles and Revisions are Managed
Two mechanics matter for operating the workflow:
- Credential handling. Connection profile metadata is tracked in the GitOps repository, but the Exasol secret itself is kept out of version control.
- Revision history. Application source, revision identity, and deployment history are stored in Git, so the server’s state can be rebuilt from the repository. This creates an inspectable history of application changes and deployments.
Three Pieces, One Workflow
The workflow separates the agent, the application lifecycle, and the analytical database while keeping them connected in the same development loop.
The takeaway
The value is a shorter path from a data question to an application people can actually use.
With an Exasol connection configured, the agent can inspect the available data, generate the SQL and Dash application, deploy a preview, respond to feedback, and promote an approved revision within the same development workflow.
Exasol provides the data and SQL execution. dash-server manages the application lifecycle. The agent connects the question to the finished application.
Get started
See the dash-server GitHub repository for setup instructions, configuration, and current documentation.