
DWH Concepts: Basics & Hands-On Tutorial

In this DWH Concepts guide, you’ll get up to speed on the basics behind modern and high-performance data warehousing, walk through a hands-on mini-project to build and query your first warehouse, and discover best practices for performance, governance, and cost management—no fluff, just exactly what you need.
Let’s dive straight into the heart of data warehouse concepts, tutorials, and foundations.
The 4 Foundational Concepts of Data Warehousing
Before we dive into the technical concepts of a modern data warehouse, it’s important to understand its original design philosophy. These four foundational concepts come from Bill Inmon, one of the earliest pioneers of data warehousing. They define what makes a warehouse fundamentally different from a regular database or data lake, even today.
The Four Inmon Concepts
Subject-Oriented
A data warehouse is organized around key business domains like sales, finance, or customers, not individual applications. This structure enables consistent, company-wide reporting.
Integrated
Data from different systems is standardized: formats, naming conventions, and data types are aligned. Integration ensures that customer IDs, currencies, and timestamps mean the same thing everywhere.
Time-Variant
Unlike operational databases, a data warehouse retains historical data. Each record includes time context (e.g., order_date, snapshot_date) to enable trend analysis over months or years.
Non-Volatile
Once data is loaded into the warehouse, it’s not updated or deleted by transactions. This stability ensures consistency and traceability over time.
These concepts laid the foundation for how data warehouses are still defined today, even in cloud-native and real-time environments.
The next section covers the more technical concepts of warehouse design: schemas, OLAP patterns, and data modeling strategies.

Try Exasol Free: No Costs, Just Speed
Run Exasol locally and test real workloads at full speed.
Core DWH Concepts & Components: Building Blocks
A Data Warehouse (DWH) is a centralized repository optimized for analytical queries and historical reporting.
Think of it as your company’s “traffic control center”—it collects data from all sources, organizes it, and provides a single pane of glass for insight.
It’s best understood by starting with the data warehouse definition in our glossary.
Before building or evaluating a data warehouse, it’s essential to understand the core concepts that shape how data is structured, queried, and scaled. Whether you’re setting up a traditional on-premises warehouse or a cloud-native platform, these principles remain the foundation of any successful implementation.
This section covers the building blocks of a DWH: how your data is organized (schemas), how it’s stored (facts and dimensions), and how it’s used (analytical vs. transactional). These aren’t just technical definitions—they influence everything from query speed and storage costs to usability for analysts and business stakeholders.
If you’re evaluating solutions or preparing to build your first DWH, this is the strategic knowledge that helps you make the right decisions from the start.
Let’s begin with the first key decision in any data warehouse: how to structure your data using Star or Snowflake schemas.
Schema Patterns: Star vs. Snowflake
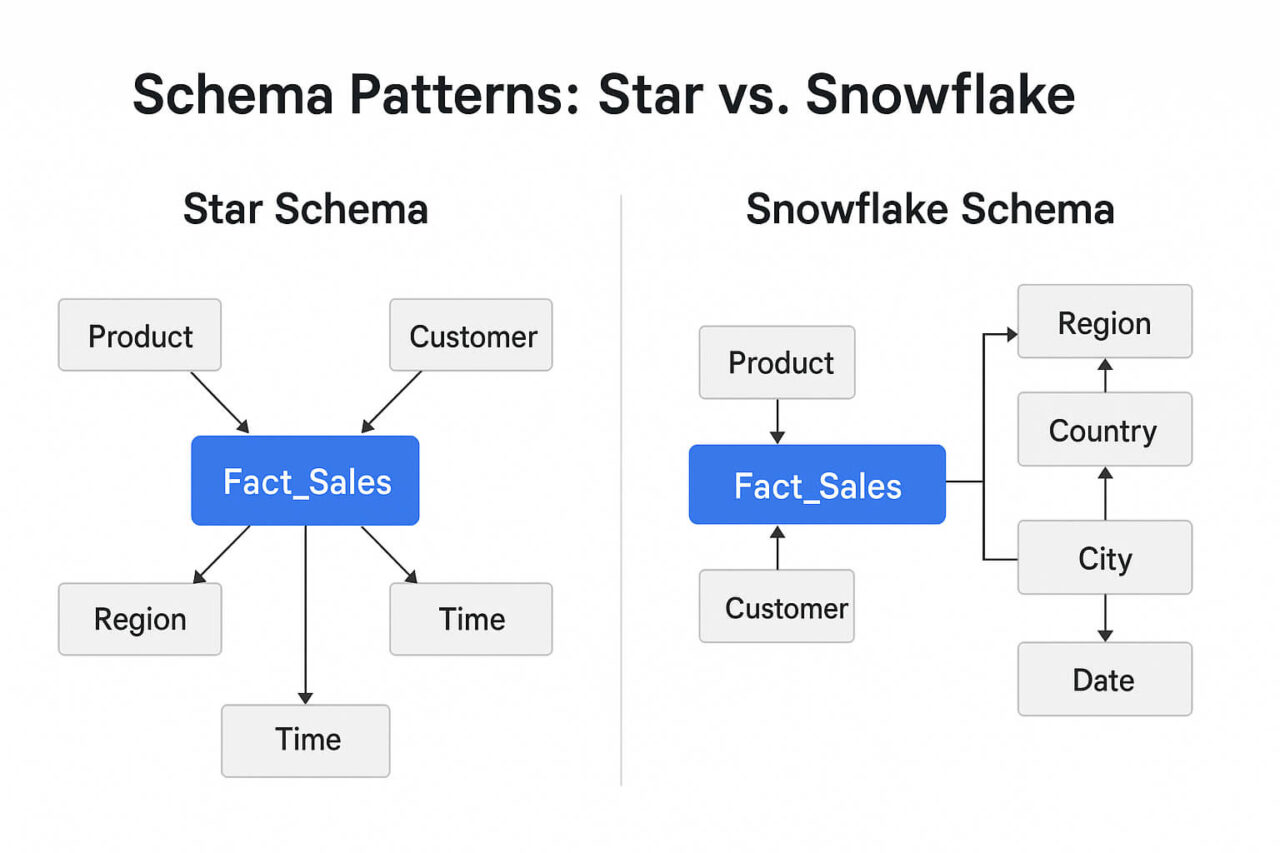
One of the most important data warehouse concepts is how you structure your schema—how your fact and dimension tables relate. Two dominant patterns exist: the Star schema and the Snowflake schema. Both define how data is logically organized for analysis, and both impact query performance, maintenance effort, and scalability.
Star Schema
A Star schema places a central fact table (e.g., sales transactions) at the center, with each dimension table (e.g., time, product, customer) connected directly to it. These dimension tables are denormalized, meaning they contain all the information needed without splitting into sub-tables.
Key Advantages:
- Fewer joins = faster query performance
- Easy for BI tools and analysts to understand
- Simpler to build and maintain
Drawbacks:
- Data redundancy (e.g., region info duplicated in multiple rows)
- Doesn’t scale well with large or hierarchical dimensions
Snowflake Schema
In a Snowflake schema, dimension tables are normalized—split into sub-tables to remove redundancy. For example, instead of storing country, region, and city in one table, they would each exist in separate linked tables.
Key Advantages:
- Reduces storage by avoiding duplicate data
- Easier to enforce data integrity
- Better for managing complex hierarchies (e.g., product categories, geographies)
Drawbacks:
- Requires more joins in queries
- Slightly higher query latency, especially on large datasets
- Can be harder for business users to navigate
Which Should You Use?
- Choose Star schema if performance and simplicity are top priorities (most reporting scenarios).
- Choose Snowflake schema if your data has deep hierarchies, needs strong normalization, or if storage is a concern.
In modern DWH systems like BigQuery or Exasol, performance differences between the two patterns can be minimized, but schema design still matters for usability, maintainability, and clarity.
Facts, Dimensions & Granularity
In any data warehouse, the two most important table types are fact tables and dimension tables. Together, they define how data is stored, queried, and aggregated.
Fact Tables
A fact table contains the measurable, quantitative data you want to analyze—things like:
- sales_amount
- units_sold
- page_views
- revenue
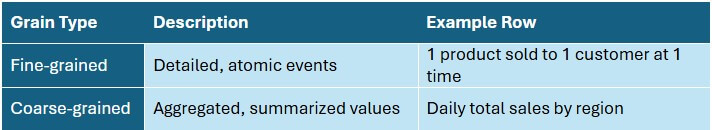
Each row represents a single event at a defined level of detail (known as the “grain”).
Example: One row might represent the total sales of a product in a single store on a specific day.
Dimension Tables
A dimension table adds context to your facts. It stores descriptive attributes like:
- product_name, product_category
- store_location, region
- customer_segment, age_group
- year, quarter, weekday
These attributes help analysts filter, group, and slice the data during analysis.
Dimensions often answer questions like: “By which product?” or “From which region?”
Granularity: Choosing the Right Level of Detail
Granularity (or “grain”) defines how detailed your data is in the fact table. It affects everything from storage size to how flexible your analysis can be.
Important: Define your grain before you load data. Changing it later usually requires a complete rebuild of your warehouse.
Fact-to-Dimension Relationships
- Fact tables often reference multiple dimensions via foreign keys.
- These relationships form the core of your schema, whether star or snowflake.
- A good practice is to include surrogate keys in your dimension tables for performance and consistency.
By understanding how facts and dimensions interact—and choosing the right granularity—you lay the groundwork for a clean, performant, and scalable warehouse.
OLTP vs. OLAP: What Makes a Warehouse Different?
A data warehouse is designed for OLAP, Online Analytical Processing, which is very different from the OLTP (Online Transaction Processing) systems used in operational databases.
While OLTP handles day-to-day transactions like customer orders or bank transfers, OLAP enables complex queries, aggregations, and multi-dimensional analysis.
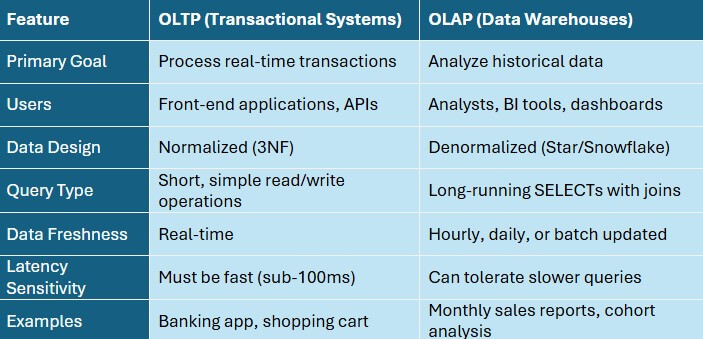
Why this matters: If you try to run OLAP-style queries on an OLTP system, you’ll hit performance and scalability issues fast. That’s exactly why data warehouses exist.
Real-World Example
OLTP scenario:
- A customer orders a product online. The system updates the order and stock quantity in real time.
OLAP scenario:
- A data analyst queries sales from the past 12 months, broken down by product category, region, and marketing channel.
These are different engines for different purposes—DWHs are built to analyze, not transact.
Next up: how these concepts come together in actual architecture patterns—from batch pipelines to real-time streams.
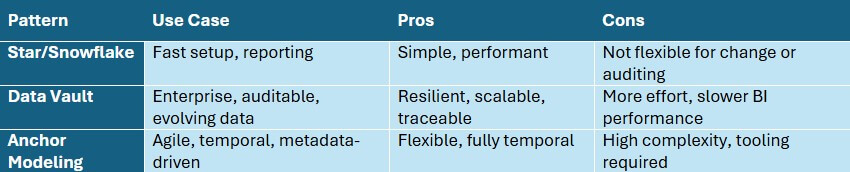
Data Modeling Patterns: When to Use What
Once you’ve defined your schema structure and granularity, the next step is choosing a data modeling pattern. This decision affects how flexible, scalable, and maintainable your data warehouse will be over time.
There’s no one-size-fits-all—each model fits different levels of complexity and business requirements.
Star/Snowflake Modeling (Dimensional)
The most common and straightforward approach, especially for BI tools.
Best for:
- Quick setup
- Reporting and dashboards
- Clear, consistent logic
Strengths:
- Simple joins
- Excellent performance
- Easy to explain to non-technical stakeholders
Limitations:
- Hard to track data history or structural changes
- Less flexible as data sources evolve
Pro tip: use this when you need fast time-to-value and your data is relatively stable.
Data Vault
A flexible, auditable model designed for long-term enterprise use.
Structure:
- Hubs = business entities (e.g. Customer, Product)
- Links = relationships (e.g. Customer_Purchased_Product)
- Satellites = contextual data + history (e.g. name, location, change timestamps)
Best for:
- Regulatory environments
- Evolving, unclean, or decentralized data
- Full auditability & change tracking
Strengths:
- Separation of raw data from transformations
- Historical tracking out of the box
- Easily scalable as sources change
Limitations:
- Slower to implement
- Requires strong data governance
- BI queries are more complex (requires transformation layer)
Pro tip: use this when you need resilience, compliance, and long-term scalability.
Anchor Modeling
A highly normalized and temporal model optimized for change.
Core principle: Every attribute is stored independently, allowing time-versioned changes to any part of a record.
Best for:
- Agile teams
- Metadata-driven warehouses
- Projects with frequently evolving data models
Strengths:
- Fully temporal (tracks every change to every attribute)
- Easy to extend or modify structure
- Pairs well with automation
Limitations:
- Higher technical complexity
- Less intuitive for reporting/BI teams
- Requires advanced tooling or custom frameworks
Pro tip: use this when your schema changes often, and you need full version control at the attribute level.
Not sure which to pick?
Start simple. Use Star schema for quick wins. As complexity grows, layer in Data Vault or Anchor Modeling to support scale, compliance, or agility.
For additional modeling guidance, the Kimball Group’s dimensional techniques remain a go-to industry reference.
Related Concepts in Modern Data Warehousing
While schema design and modeling patterns form the core of a data warehouse, a complete understanding of data warehousing concepts includes the surrounding processes and tools that support storage, access, and governance.
Here’s how the data warehouse fits into the broader analytics stack:
ETL / ELT
ETL (Extract, Transform, Load) and ELT (Extract, Load, Transform) are data pipeline processes that move raw data from source systems into the warehouse.
- ETL performs transformations before loading.
- ELT loads data first, then transforms it inside the DWH, commonly used in cloud-native platforms.
These pipelines form the foundation of how data enters your warehouse.
Data Marts
A data mart is a focused subset of a data warehouse, typically scoped to a department like marketing, finance, or HR.
- They improve performance and simplify access by isolating relevant data.
- Data marts are often fed by the central warehouse, not separate systems.
Think of a warehouse as the backend, and data marts as team-specific views.
Business Intelligence (BI) Tools
BI tools are what business users interact with, not the warehouse itself.
- Tools like Power BI, Tableau, Looker, and Superset connect to the DWH to run queries, generate reports, and build dashboards.
- A clean schema (star/snowflake) improves self-service exploration.
A good warehouse makes BI tools faster, not more complicated.
Metadata & Data Governance
Modern DWHs track metadata like schema definitions, data lineage, load timestamps, and access logs.
Governance features include:
- Role-based access control (RBAC)
- Change tracking (e.g., dbt docs or Exasol virtual schemas)
- Data quality checks and monitoring
These systems are critical for auditing, security, and compliance, especially in enterprise environments.
Together, these supporting layers turn a data warehouse from a database into a business-ready analytics platform. And now that you have the full picture, we’ll shift from concepts to fundamentals and practical implementation in the hands-on tutorial.
Try Exasol Free: No Costs, Just Speed
Run Exasol locally and test real workloads at full speed.
DWH Fundamentals
Let’s zoom out and cover the fundamentals of a data warehouse—why organizations build them, what problems they solve, and where they deliver value.
This is your crash course in DWH basics.
Why Organizations Use Data Warehouses
A data warehouse acts as your company’s central nervous system for analytics. It collects, stores, and organizes data from various operational systems, making it easier to generate reports, track performance, and make decisions.
Common goals:
- Eliminate inconsistent data across systems
- Consolidate reporting into one trusted source
- Enable faster, deeper analysis over long timeframes
- Support self-service BI for business teams
Top 5 Use Cases for Data Warehousing
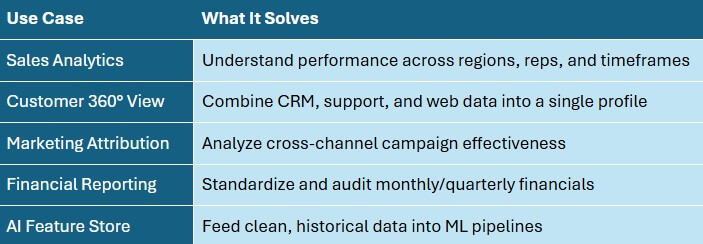
These aren’t just “big company” use cases. Even small teams benefit from unified, query-ready data.
Key Benefits of a DWH
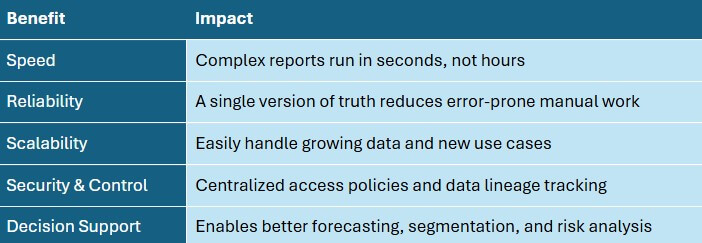
Modern data warehouses are increasingly hybrid in nature. Rather than choosing between traditional on-premises systems and cloud-native platforms, many organizations adopt a mixed architecture. This allows them to keep critical or sensitive data on-prem while leveraging cloud services for elasticity, analytics, and storage at scale.
Florian Wenzel, VP of Product
The decision between on-prem vs cloud depends on factors like latency, compliance, data sovereignty, and cost structure.
Hands-On Tutorial: Build Your First DWH
Let’s put theory into practice. In this tutorial, you’ll walk through a simplified but realistic data warehouse setup—from schema creation to running your first query. Whether you’re testing a cloud platform or working locally, these steps will help you understand how the pieces fit together.
You’ll need:
- A SQL-compatible data warehouse (e.g. Exasol, PostgreSQL)
- Basic SQL and Python knowledge
- Optional: Airflow or another orchestration tool
Project Setup: Define Your Schema
We’ll start with a star schema for retail sales analysis. Our fact table will track transactions, and dimension tables will provide context.
Tables:
- fact_sales
- dim_product
- dim_store
- dim_date
SQL snippet:
CREATE TABLE dim_product (
product_id INT PRIMARY KEY,
product_name VARCHAR,
category VARCHAR
);

CREATE TABLE dim_store (
store_id INT PRIMARY KEY,
region VARCHAR,
store_type VARCHAR
);

CREATE TABLE dim_date (
date_id INT PRIMARY KEY,
date DATE,
year INT,
month INT,
weekday VARCHAR
);

CREATE TABLE fact_sales (
sales_id INT PRIMARY KEY,
product_id INT,
store_id INT,
date_id INT,
units_sold INT,
revenue DECIMAL(10,2),
FOREIGN KEY (product_id) REFERENCES dim_product(product_id),
FOREIGN KEY (store_id) REFERENCES dim_store(store_id),
FOREIGN KEY (date_id) REFERENCES dim_date(date_id)
);
Load and Transform Data
You can load your data in batches or real time. For this tutorial, we’ll use a simple Python script and simulate a batch load.
Python + SQL Example:
import pandas as pd
                            import sqlalchemy

                            engine = sqlalchemy.create_engine("your_connection_string")

# Load CSV data
  df_products = pd.read_csv("products.csv")
df_products.to_sql("dim_product", engine, if_exists="append", index=False)
Pro Tip: Use tools like dbt or Airflow if your pipeline gets more complex.
Run Your First Query
Now that your tables are set up and populated, you can start analyzing.
Example query:
SELECT
                            d.year,
                            p.category,
SUM(f.revenue) AS total_revenue
               FROM fact_sales f
               JOIN dim_product p ON f.product_id = p.product_id
                                                    JOIN dim_date d ON f.date_id = d.date_id
                                                                                   GROUP BY d.year, p.category
ORDER BY d.year, total_revenue DESC;
This gives you revenue breakdown by product category over time—exactly the kind of insight OLAP systems are built for.
Visualize the Results
Load the query output into a BI tool like Tableau, Power BI, or even a Jupyter notebook chart.
Try plotting revenue over time by category to identify seasonal trends or top performers.
This hands-on example gives you a working foundation for a data warehouse tutorial, loading, and querying. In the next section, we’ll show you a short example using Exasol as the technology behind dashboarding:
Frequently Asked Questions
The four foundational concepts of a data warehouse are: subject-oriented, integrated, time-variant, and non-volatile. These principles ensure the data is reliable, unified, historically accurate, and stable for reporting and analysis.
The main components are:
- BI tools (dashboards, reports)
- Data sources (CRM, ERP, etc.)
- ETL processes (extract, transform, load)
- Data storage (fact and dimension tables)
Key features include:
- Integrated data across sources
- Historical (time-variant) storage
- Subject-oriented organization
- Non-volatility, meaning data remains stable after loading
These traits make DWHs ideal for long-term analytical use.
The three primary data warehouse models are:
- Star schema – simple and fast
- Snowflake schema – normalized dimensions
- Data Vault – scalable and auditable
Each model suits different levels of complexity and control.
A data warehouse stores enterprise-wide data across all functions. A data mart is a focused subset, scoped to a specific team or department for faster, simpler access to relevant information.