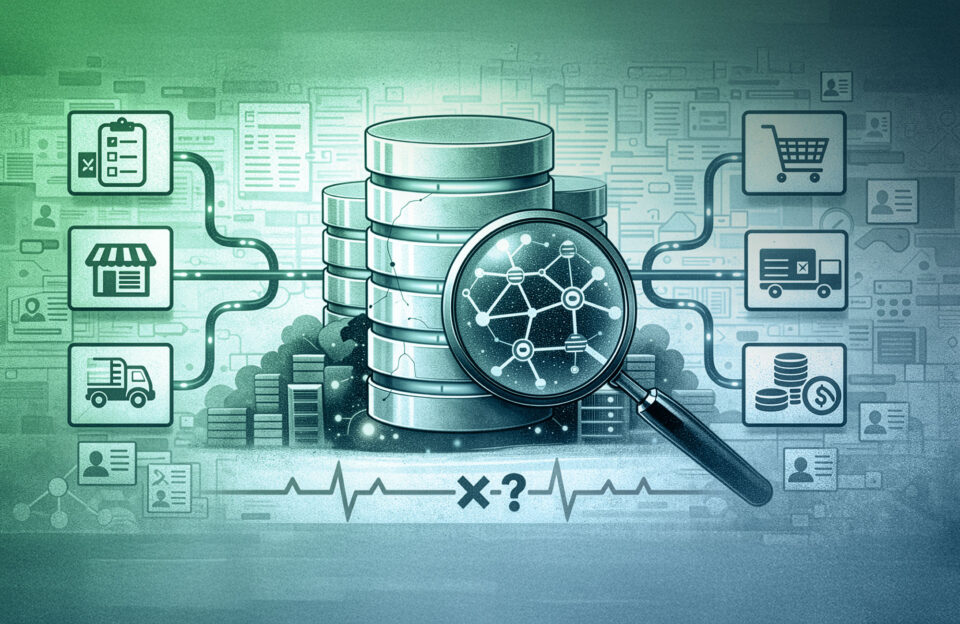
Why Your BI Stack Knows More About Your Processes Than You Think

When people talk about Business Intelligence, they usually talk about reporting and analytics: sales figures, operational KPIs, compliance reports, or dashboards summarizing what happened last week or last quarter. What they rarely talk about is how workflows through their systems.
That gap is surprising. Every modern business or technical process leaves behind detailed digital traces. Log files, timestamps, state changes, and identifiers are generated automatically by applications, middleware, and infrastructure components. We collect and store this data diligently – but most of the time, we only use it to answer outcome-oriented questions, not to understand the process itself.
This article argues that Business Intelligence teams should look beyond traditional reporting and consider Business Process Analysis and Process Mining as a natural extension of their BI stack. You don’t need specialized tools to get started. With the right data model and a capable analytical database, you can build powerful process mining capabilities directly on top of your existing data infrastructure.
The Demonstrator: How to do Business Process Mining on your BI Stack
To showcase the feasibility of the idea outlined above, I have developed my own visual business process analytics demonstrator and open-sourced it – all built on free software solutions. Would be happy if you find this useful, and I’d appreciate any community feedback or contributions.
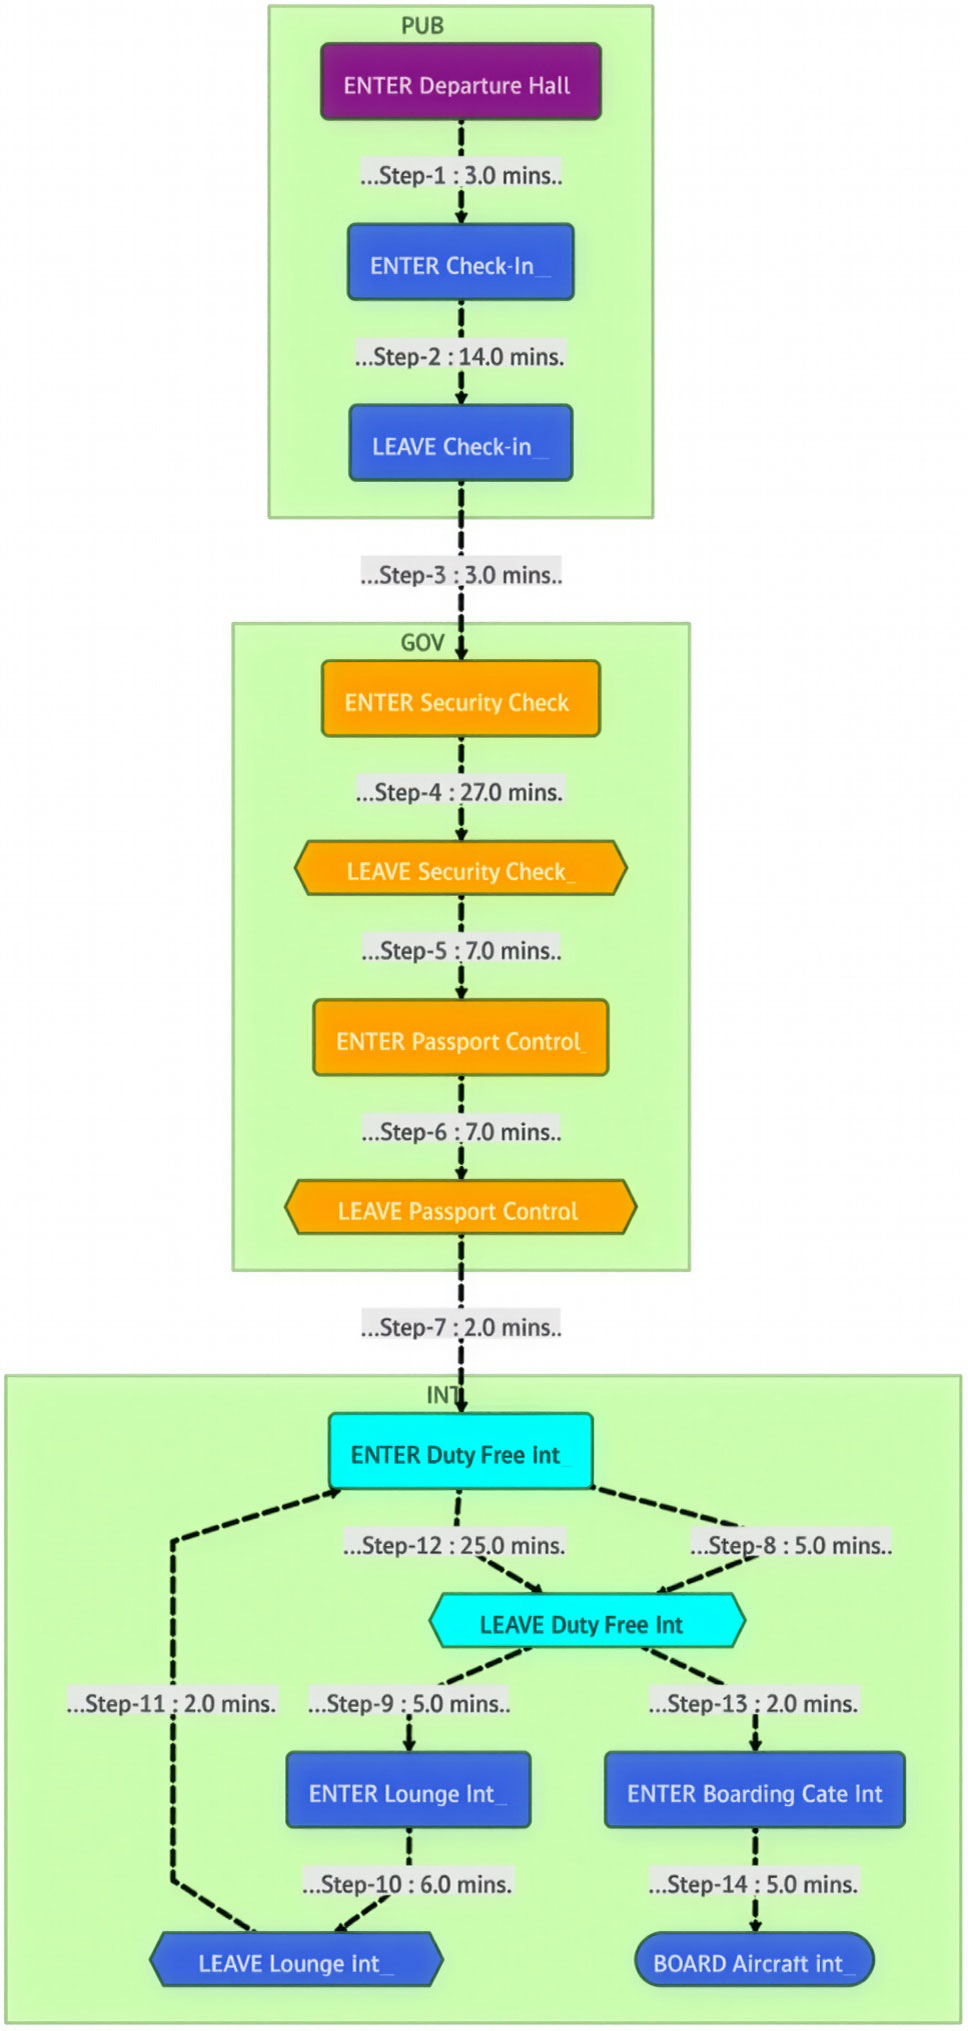
The frontend was built with Marimo, a reactive notebook framework similar to Jupyter Notebooks, but based on a dataflow execution model rather than manual cell execution. SQL integration is handled via SQLAlchemy, and visualization via Mermaid. As database backend, the free Exasol Personal is used. For identifying interesting patterns in the resulting event flows, I integrated a local LLM using LM-Studio and Ollama. All operations happen directly in the database. There are no temporary local data structures or caches. Every single user interaction triggers live SQL queries, ensuring maximum flexibility and immediate visibility of new process steps. The resulting visual representation looks like the following example, showing the process steps of a passenger journey throughout a major international airport.
The Demonstrator offers the following capabilities:
- Filter and search effectively across the process graph
- Compare two graphs of the same process to identify differences and patterns
- Inspect individual process flows and journeys in detail
- Use AI-assisted analysis to better understand process behavior
If you are new to process mining and would like to see how the tool works in practice, watch the short video below.
In the following sections, I’m going to describe why this all matters for BI teams and exactly describe how we built it based on a simple SQL table, standard open-source tools and how a local LLM can facilitate AI-driven insights for Business Process Mining.
Why Business Process Mining Matters
Traditional BI tells you what happened. Business Process Mining tells you how it happened.
Understanding the real behavior of a process often reveals opportunities that are invisible in aggregated reports. Bottlenecks, loops, rework, unexpected detours, or rare paths that consume disproportionate resources tend to disappear when data is reduced to averages and totals.
Consider a few examples. A home loan application process may look straightforward on paper, but applications may bounce back and forth between validation, enrichment, and manual review. An insurance claim might take days not because of a single slow step, but because of repeated handovers. Even highly technical processes, such as network traffic handling or system event processing, can be analyzed in the same way.
Business Process Mining helps companies reduce complexity, lower operational costs, improve customer experience, and identify structural inefficiencies. Often, the return on investment is immediate: fixing one recurring bottleneck can have a measurable financial impact.
Process Mining in a Nutshell
Process Mining is a methodology that reconstructs and analyzes processes by using digital forensic data – typically event logs generated by operational systems. Instead of relying on predefined process diagrams, it derives the actual process behavior from data.
At its core, process mining works by grouping events into journeys and ordering them by time. Each journey represents one instance of a process. Each step represents a specific action within that journey. Steps can repeat, creating cycles, and journeys may be incomplete when analyzed.
The output is a graph representation of the process: nodes represent steps, edges represent transitions between steps, and metrics describe how often and how quickly transitions occur. This graph can be analyzed globally or filtered down to individual journeys.
A Simple but Powerful Data Model
From a technical perspective, process mining does not require a complex schema. A single event table is sufficient, provided it follows a consistent structure. In our case, the table contains:
- A process identifier to distinguish different processes
- A timestamp
- A unique journey identifier
- A step name or step ID (using integers for performance)
- Optional meta fields for filtering and segmentation
This table can become very large, but its structure remains simple. The real work happens when transforming this raw event data into transitions between steps. Practitioners may think about challenges such as late-arriving events, ordering guarantees, or clock skew – all of which are well-known aspects of event-driven data processing and can be addressed depending on the use case.
Filtering Journeys, Not Just Rows or Columns
Filtering is one of the most critical aspects of process analysis. Filtering rows is easy. Filtering journeys is not, as it explodes computational costs.
You may want to exclude all journeys that contain a certain step or include only journeys that pass through a specific activity. You may want to filter by metadata such as location, customer segment, or channel. You may want to compare two versions of the same process under different filter conditions.
Our demonstrator supports filtering by steps, tags (up to three per journey), and date ranges. Excluding a step removes all journeys that contain it. Including a step retains only journeys that contain it. Priority between inclusion and exclusion can be defined explicitly.
All this logic is implemented in SQL, without intermediate data structures or cached results.
Building the Transition Table with SQL
The transition table is the core artifact of process mining. It contains all transitions between steps, aggregated by a selected metric such as count or duration statistics.
You can build the transition table in a single SQL statement using Common Table Expressions (CTEs). I’ve used them primarily to structure the query for readability and maintainability; they are not intended as materialization boundaries, and the database optimizer is free to inline and reorder them as needed. The workflow restricts the dataset by date range and tags, applies inclusion and exclusion rules on journeys, constructs process chains, and finally aggregates transitions. The structure of the SQL looks as follows (exactly as used in the demonstrator):
WITH TIMED_JOURNEYS AS (
	<Select records for selected project, date range and tags>
),
EXC_EVENTS AS (
	<Filter those records that contain selected process steps>
),
INC_EVENTS AS (
	<Keep those records that contain selected steps>
),
FILTERED_JOURNEYS AS (
	<Create working set based on the above generated data sets>
),
PROCESS_CHAINS AS (
	<Create the process chains and calculate transition time in seconds>
)
SELECT
    FROM_STEP,
    TO_STEP,
    COUNT(DISTINCT EVENT_ID),
    AVG(DURATION_SECONDS),
    MIN(DURATION_SECONDS),
    MAX(DURATION_SECONDS),
    MEDIAN(DURATION_SECONDS),
    STDDEV(DURATION_SECONDS)
FROM
    PROCESS_CHAINS
GROUP BY
    FROM_STEP, TO_STEP
HAVING
    FROM_STEP <> TO_STEP
ORDER BY
    FROM_STEP
This result set contains everything needed to build a flowchart and compute statistics for further analysis.
Visualizing Processes with Mermaid
To visualize the process graph, I used the Mermaid charting library. Mermaid is well-known, easy to integrate, and natively supported by Marimo.
The following excerpt shows a simplified subgraph of the overall process flow for the ”Airport Passenger Flow” example; nodes represent individual steps, while edges encode transitions annotated with their respective metrics. Styling information has been omitted for clarity.
    subgraph DOM__________
        LEAVE_Lounge_Dom["LEAVE Lounge Dom_____"]@{ shape: hex }
        BOARD_Aircraft_Dom["BOARD Aircraft Dom_____"]@{ shape: stadium }
        LEAVE_Duty_Free_Dom["LEAVE Duty Free Dom_____"]@{ shape: hex }
        ENTER_Boarding_Gate_Dom["ENTER Boarding Gate Dom_____"]@{ shape: rounded }
        DENIED_Boarding_Dom["DENIED Boarding Dom_____"]@{ shape: odd }
        LEAVE_Dining_Area_Dom["LEAVE Dining Area Dom_____"]@{ shape: rounded }
        ENTER_Lounge_Dom["ENTER Lounge Dom_____"]@{ shape: rounded }
        ENTER_Duty_Free_Dom["ENTER Duty Free Dom_____"]@{ shape: rounded }
        ENTER_Dining_Area_Dom["ENTER Dining Area Dom_____"]@{ shape: rounded }
    end

    …

    ENTER_Baggage_Drop e1@== ..........34,995.......... ==>LEAVE_Baggage_Drop
      e1@{ animate: true }
    ENTER_Check_In e6@== ..........36,793.......... ==>LEAVE_Check_In
      e6@{ animate: true }
    ENTER_Departure_Hall e7@== ..........49,430.......... ==>ENTER_Security_Check
      e7@{ animate: true }
    ENTER_Departure_Hall e8@== ..........34,995.......... ==>ENTER_Baggage_Drop
      e8@{ animate: true }
    ENTER_Departure_Hall e9@== ..........2,413.......... ==>LEAVE_Departure_Hall
      e9@{ animate: true }
    ENTER_Departure_Hall e10@== ..........36,793.......... ==>ENTER_Check_In
      e10@{ animate: true }
    LEAVE_Baggage_Drop e19@== ..........34,995.......... ==>ENTER_Security_Check
      e19@{ animate: true }
    LEAVE_Check_In e20@== ..........36,793.......... ==>ENTER_Security_Check
      e20@{ animate: true }
Edges between steps include metrics such as transition counts and can be animated to highlight flow intensity.
AI-Supported Insights with LLMs
Large Language Models (LLMs) can help you to get some valuable insights out of your business process by generating hypotheses and highlighting unusual patterns. They should not be treated as authoritative sources, but as assistants. Specific LLMs can make mistakes, and eventually they will.
The LLM is used purely as an analytical aid: it never modifies data, drives automation, or replaces human judgment, and all conclusions need to be validated against the underlying database results.
In our setup, the transition table is converted into a textual representation and passed to an LLM along with a carefully crafted system prompt. The prompt must describe the process domain explicitly, because the model does not understand business context on its own.
One example for the airport data is that it’s totally normal that passengers passing through security is much higher than the number of passengers visiting a Frequent Flyer lounge, as this is the standard journey of a passenger entering the airport. If you feed your LLM with such context, it will be enabled to find the actually interesting outliers or peculiarities.
In my demonstrator, I run inference locally to avoid sending sensitive process data to external services. During our tests, I used the “qwen/qwen3-coder-30B” model with LM-Studio and Ollama. But it might be worth testing several LLMs for your specific use case to optimize results.
The core Python code used to invoke the LLM is shown below:
result_AI_analysis = None
llm = ChatOpenAI(model_name="qwen/qwen3-coder-30b",
                         temperature=0.25,
                         openai_api_base=f"{llm_server}",
                         openai_api_key=f"{llm_api_token}",
                         )

prompt = ChatPromptTemplate.from_messages(
    [
        ("system", system_prompt),
        ("human", "{flowchart_data}"),
    ]
)

messages = prompt.format_messages(flowchart_data=flowchart_data)
result_AI_analysis = llm.invoke(messages).content
Scale, Privacy, and Real-World Constraints
The scale of process data varies widely. Some processes generate only a few thousand steps. Others produce millions or even billions of events over time. Tracking passenger movement in a major international airport or analyzing network traffic over several years quickly leads to datasets of massive size.
Privacy is another important aspect. Process mining often involves identifiers that can be linked to individuals. In our demonstrator, identifiers are anonymized using a one-way MD5 hash, regardless of the use case or source. This approach is sufficient to protect personal data while still enabling process reconstruction. This form of hashing is used for pseudonymization rather than cryptographic security, and is sufficient in this context because identifiers are only needed to correlate events within a journey.
It is also important to clarify what process mining is not. It is not a real-time monitoring or observability solution. New steps become visible with the next query execution, not instantaneously. Process mining is typically applied after process steps have occurred – often after the process has finished.
Why Exasol Works Well for This Use Case
While we decided to keep all operations on the database / SQL level, with no temporary or session-related data structures in any application layers, the requirements for the database are higher. Especially if your event data consists of billions of records or if you want to analyze many business or technical processes. That’s why doing process mining at scale using an SQL database requires a fast, scalable query engine.
Exasol’s MPP architecture, in-memory acceleration, flexible distribution/partitioning mechanisms, high concurrency scalability make it a strong foundation for such use cases. You can use Exasol Personal without any license costs – even for productive use cases. This makes it easy for developers and data engineers to experiment, build prototypes, and deploy internal tools without procurement hurdles.
In practice, this enables interactive analysis even when working with event tables containing millions to billions of records, where analysts can repeatedly change filters and immediately observe how the process graph changes.
How to Test It Yourself
The complete demonstrator, including setup instructions and example data, is available in the Exasol Labs at https://github.com/exasol-labs/exasol-labs-ai-process-mining. This allows interested developers to explore the implementation, adapt it to their own processes, and build custom Business Process Mining tools on top of their existing data stack. If you have any feedback, please let me know. And I’m grateful for any additional contributions to the project! But please keep in mind that this code is not ready for production, is not yet organized into submodules, and should be considered an early proof of concept.
Closing Thoughts
Process mining should not be treated as a niche discipline with specialized tooling. It is a natural extension of Business Intelligence – one that shifts the focus from outcomes to behavior.
If you already collect event data, you already have what you need to get started. With a capable analytical database, SQL, and a few well-chosen open-source tools, you can easily uncover insights that traditional BI will never show you. This capability significantly increases the impact of data analysis by shifting the focus from isolated metrics to understanding how real processes behave over time.
If you don’t do this, nothing breaks. But chances are your competitors already using Process Mining.
As always –happy Exasoling!