ExaBench: An Open Database Performance Leaderboard

1. What Is ExaBench
Choosing a database today often means spending weeks running your own tests or trusting some online benchmark results. But can those really be trusted?
Vendor benchmarks tend to favor the vendor. ClickBench, created and hosted by ClickHouse, uses a single flat table that plays to columnar scan engines; Apache DataFusion’s maintainer coined the term “BenchMaxxing” for the kind of benchmark-specific optimization that rarely provides any real-life benefits.
On the other end of the spectrum, we have highly regulated benchmarks like TPC-H: official TPC audits solve the methodology problem but create an access problem: mandatory third-party auditing, submission costs, 100-page specifications. The result is a platform for the elite, severely lacking results from smaller companies or newcomers.
I built Benchkit and ExaBench because I wanted a valid middle-ground option: an open, reproducible database performance leaderboard that anyone can verify and anyone can contribute to. It currently covers 56 configurations across five systems (Exasol, ClickHouse, StarRocks, Trino, and DuckDB), starting with the TPC-H workload, with more workloads to follow. The leaderboard is open to any database that can run the queries; adding a new system or a new workload is a code contribution to the Benchkit framework. Every entry publishes raw query timings, the exact configuration used, and full hardware details.
Every leaderboard entry publishes four files in the repository:
runs.csv– raw query timings for every runconfig.yaml– exact benchmark configurationsystem_<name>.json– hardware and OS detailssetup_<name>.json– installation and tuning steps
All inspectable. All diffable. If you suspect unfair tuning, you can check.
Disclosure: I work at Exasol as a Principal Architect. That is exactly why ExaBench is designed so you do not have to trust me. Every configuration file, every raw timing, and all scoring code are published as open source. If you disagree with any of it, you can fork the repository and change it.
2. What BenchScore Measures
Every leaderboard entry collapses hundreds of query timings into a single number. That number must reward fast queries and fast total throughput, scale with data size and concurrency, and resist gaming by cherry-picking queries. BenchScore does this by combining two sub-scores.
2.1 The Formula
BenchScore  = √(SpeedScore × ScaleScore)
SpeedScore  = SF × √S / geomean(mins)
ScaleScore = SF × S × Q / sum(medians)| Variable | Definition |
|---|---|
| SF | Scale factor (data size). SF50 = 50 GB of raw TPC-H data. |
| S | Number of concurrent query streams. |
| Q | Expected query count for the workload (22 for TPC-H, 43 for ClickBench). |
| geomean(mins) | Geometric mean of per-query minimum runtimes (seconds). |
| sum(medians) | Sum of per-query median runtimes (seconds). |
2.2 Why Two Sub-Scores
SpeedScore uses the minimum runtime of each query, the best the system can achieve, and combines them with a geometric mean. The geometric mean prevents a single fast query from masking slow ones: if Q01 runs in 0.01 s but Q17 takes 10 s, the geometric mean stays close to the slow query rather than averaging them to 5 s.
ScaleScore uses the median runtime, the typical wall-clock experience, and sums them into a total workload time. The median is robust to outlier runs (a single GC pause or network hiccup does not skew the result), and summing captures how long the entire benchmark actually takes.
The √S factor in SpeedScore gives partial credit for concurrency. Running 16 streams is harder than running 1, so it should score higher, but not 16× higher. The square root means 16 streams earn a 4× multiplier, not 16×. This prevents gaming by simply adding more concurrent clients on a machine that cannot actually handle them.
The final BenchScore is the geometric mean of the two sub-scores: √(Speed × Scale). This penalizes imbalance. A system that is 10× better on SpeedScore but 10× worse on ScaleScore nets a BenchScore of 1×, not 5.5×. You must be good at both.
2.3 Worked Example
The current #1 entry is Exasol on r6id.16xlarge with SF50 and 16 streams:
geomean(mins)= 0.2014 ssum(medians)= 17.97 sSpeedScore= 50 × √16 / 0.2014 = 50 × 4 / 0.2014 = 993.0ScaleScore= 50 × 16 × 22 / 17.97 = 17600 / 17.97 = 979.6BenchScore= √(993.0 × 979.6) = 986.3
Both sub-scores are close (993 vs 980), meaning this configuration is well-balanced: fast per-query latency and fast total throughput. A system with a SpeedScore of 993 but a ScaleScore of 100 would achieve only √(993 × 100) = 315 (the geometric mean punishes the weak side).
3. The Leaderboard Today
3.1 Top 10 by BenchScore
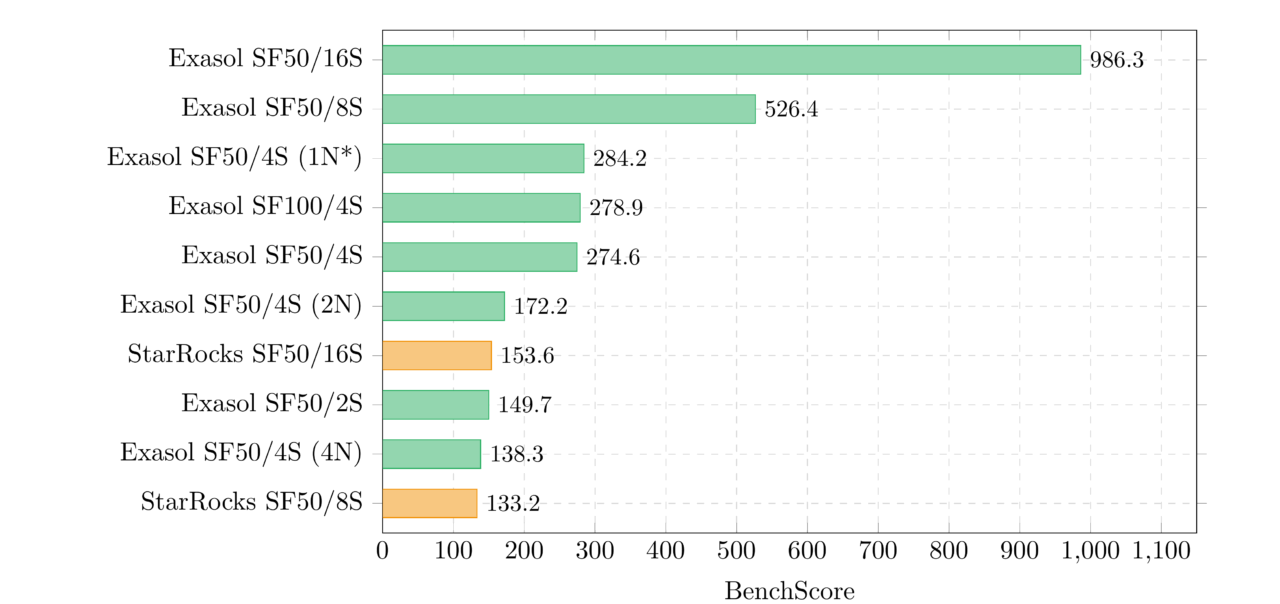
The top of the leaderboard is dominated by high-concurrency configurations. The #1 entry (986.3) runs 16 concurrent streams on a 64-vCPU machine, the largest configuration in the dataset. But raw hardware is not enough: StarRocks on identical hardware scores 153.6, and ClickHouse scores 100.5. The scoring formula amplifies per-query speed differences because they compound across 22 queries.
Entry #4 (Exasol SF100/4S, 278.9) is interesting: it runs twice the data on the same instance type as entry #5 (SF50/4S, 274.6) and scores nearly the same. Doubling the data on proportional hardware barely changes BenchScore, which is exactly what “ideal scaling” looks like through the lens of this metric.
3.2 Score Distribution by System
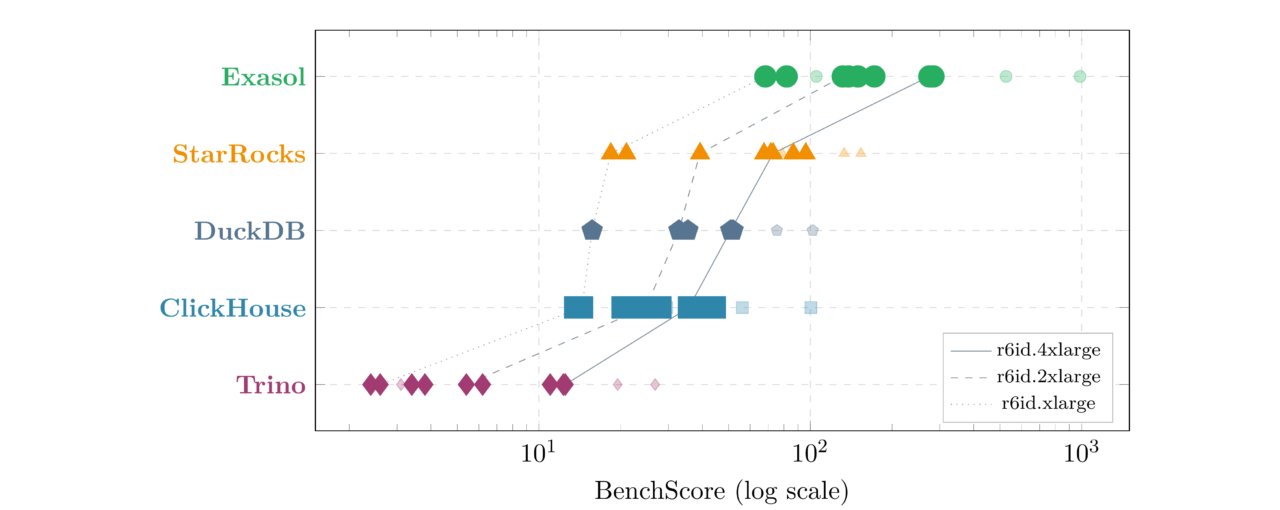
| System | Entries | Best | Median | Worst | Best Configuration |
|---|---|---|---|---|---|
| Exasol | 12 | 986.3 | 160.9 | 68.3 | SF50/16S/r6id.16xlarge |
| StarRocks | 12 | 153.6 | 72.2 | 18.4 | SF50/16S/r6id.16xlarge |
| DuckDB | 8 | 102.1 | 43.1 | 15.7 | SF50/16S/r6id.16xlarge |
| ClickHouse | 12 | 100.5 | 28.8 | 13.6 | SF50/16S/r6id.16xlarge |
| Trino | 12 | 26.8 | 5.8 | 2.4 | SF50/16S/r6id.16xlarge |
3.3 SpeedScore vs ScaleScore
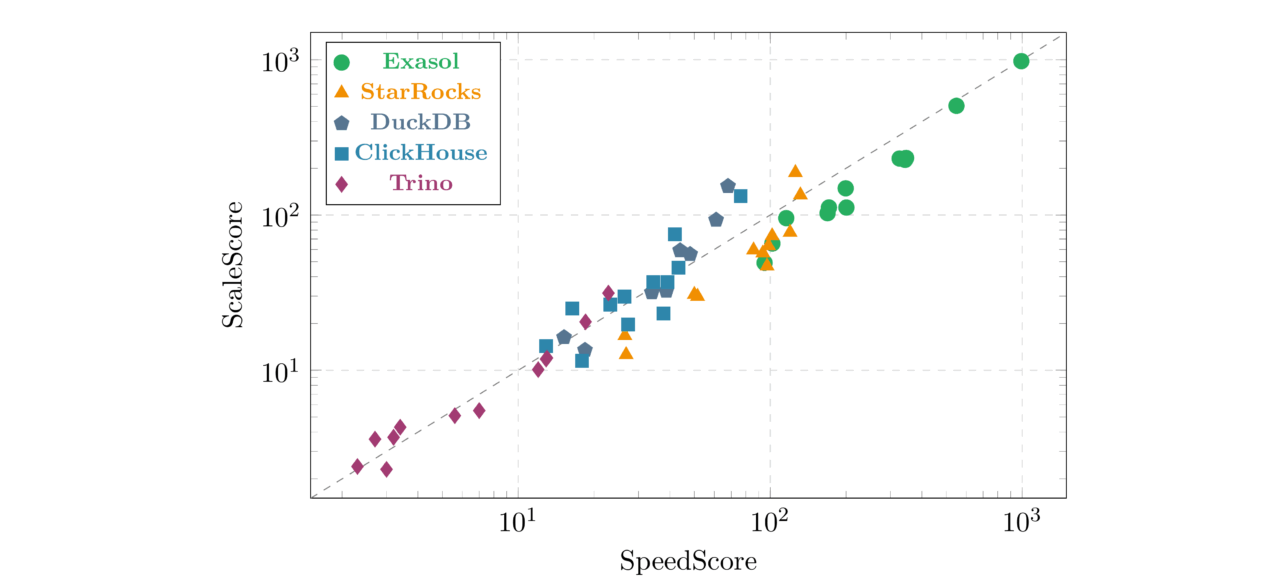
Exasol entries tend to sit slightly below the diagonal; their SpeedScore (per-query minimums) is consistently stronger than their ScaleScore (total medians). This reflects Exasol’s in-memory architecture: best-case latency is exceptionally low, while typical-case medians include occasional JIT compilation or memory management pauses.
DuckDB and ClickHouse entries sit slightly above the diagonal, meaning their total throughput (ScaleScore) is relatively stronger than their per-query peaks. These systems benefit from consistent, predictable query runtimes; the gap between minimum and median is small.
4. What the Numbers Reveal
Several patterns emerge from the 56-entry dataset:
Concurrency dominates the ranking. The top 6 entries all have 8+ streams. BenchScore grows with √S, so 16-stream configurations earn a 4× multiplier over single-stream runs. This is by design: handling concurrent users on proportional hardware is a legitimate test of system architecture.
Hardware scaling is not free. Exasol on r6id.4xlarge scores 284.2 with SF50/4S; the same system on r6id.xlarge (4× less hardware) with 4 nodes scores 138.3. Same total CPU and RAM, but the overhead of distributing queries across nodes costs roughly half the BenchScore. This is visible in every system that supports multinode deployment.
Multinode overhead is real but varies. Exasol drops from 274.6 (single-node) to 172.2 (2-node) to 138.3 (4-node) to 105.2 (8-node) – distributing the same hardware across twice as many, half-sized nodes costs ~20–30% of BenchScore. StarRocks shows a similar but gentler decline: 72.9 (1N) to 96.2 (2N) to 86.5 (4N) to 78.9 (8N) – it actually improves going to 2 nodes, consistent with the FE/BE architecture benefiting from moderate distribution.
Cross-system gaps are large. Exasol’s best entry (986.3) is 6.4× higher than StarRocks’s best (153.6), and 36.8× higher than Trino’s best (26.8). These gaps reflect fundamental architectural differences (in-memory vs disk-based, MPP vs federated), not just tuning deltas.
5. Why Existing Benchmarks Fall Short
Database benchmarks have a credibility problem. Three recurring failures explain why, and each one shaped ExaBench’s design.
Official TPC benchmarks solve the methodology problem but create an access problem: 100-page specifications, mandatory third-party auditing, and submission costs that put them out of reach for most teams. The academic paper “Fair Benchmarking Considered Difficult” (Raasveldt et al., 2018; the DuckDB/CWI team) catalogs what goes wrong when teams try anyway: cherry-picked configurations, different hardware, insufficient runs, selective query reporting.
5.1 Cherry-Picked Workloads
ClickBench (created and hosted by ClickHouse) uses a single flat table that favors columnar scan engines. Apache DataFusion’s maintainer Andrew Lamb explicitly labeled their ClickBench optimization effort a “Vanity Benchmark” and coined the term “BenchMaxxing” for benchmark-specific optimizations that do not help real users.
ExaBench uses standard TPC-H-22 queries over an 8-table normalized schema with joins, aggregations, subqueries, and correlated filters. No single-table shortcuts. The leaderboard is designed to grow workloads (ClickBench, Estuary, TPC-DS are planned), not lock into one.
5.2 Black-Box Configurations
A vendor publishes a chart but not the configs. On Hacker News, a widely-upvoted comment showed that Hydra’s ClickBench comparison used PostgreSQL with shared_buffers = 128 MB (the default) against Hydra with 8 GB; a 64× difference that changes the story entirely.
ExaBench addresses this by publishing the four files described in Section 1 for every entry. If you suspect unfair tuning, the evidence is one click away.
5.3 No Adversarial Testing
Even an honest benchmark reflects one team’s tuning choices. The TimescaleDB co-founder put it well: “As a developer, I’m very wary of technologies that claim to be better at everything, especially those who hide their weaknesses.” But a single team cannot be expert in every database system on the leaderboard.
The leaderboard accepts contributions from anyone. If you think ClickHouse is misconfigured, submit your own optimized entry. The framework (Benchkit) runs on any hardware, any cloud. You control the tuning, the instance type, and the database version. The scoring formula is the same for everyone.
6. How to Contribute
Every entry on the leaderboard today was submitted by the same team, run on AWS r6id instances, with one set of tuning choices per system. That is worth being direct about.
This makes the current leaderboard a controlled experiment: same hardware family, same cloud, same benchmark operator. That has value: it isolates software differences from infrastructure noise. But it is not yet a community benchmark. The infrastructure is ready. The framework runs benchmarks, the scoring formula normalizes results, the contribution process accepts pull requests, and the leaderboard page renders everything automatically. What is missing is diversity.
Here is what would make ExaBench credible:
- Entries from people who do not work at Exasol. Independent results are worth more than any amount of methodology documentation.
- Different clouds. GCP, Azure, on-premises bare metal. Cloud-specific networking and storage can shift results in ways that matter.
- Different instance families. Compute-optimized (c7i) vs memory-optimized (r6id) vs storage-optimized (i4i). Do the rankings change?
- Newer database versions. ClickHouse 26.x, StarRocks 5.x, DuckDB 1.5+, Trino 480+. Version-to-version tracking shows whether systems are getting faster.
- New systems entirely. PostgreSQL, Greenplum, Databend, Apache Doris, any system that can run TPC-H queries qualifies.
- Different tuning. Same system, same hardware, better configuration. If you can make ClickHouse score higher on r6id.4xlarge than our entry does, that is exactly the kind of result the leaderboard needs.
- More workloads. ClickBench (43 flat-table web analytics queries), Estuary, TPC-DS- and others are welcome. The framework and scoring formula are workload-agnostic.
The first contribution from someone who does not work at Exasol will be the most important entry on the leaderboard.
6.1 Run the Benchmark
Install Benchkit and run the standard pipeline:
pip install benchkit

benchkit check   -c config.yaml
benchkit infra   apply -c config.yaml
benchkit setup   -c config.yaml
benchkit load    -c config.yaml
benchkit run     -c config.yaml
benchkit infra   destroy -c config.yaml
6.2 Prepare Your Submission
Create a config YAML in public/performance/tpch/ using the naming convention:
{system}_{nodes}_{instance}_{sf}{scale}_{streams}s.yamlFor example: clickhouse_sn_c7i2xl_sf50_1s.yaml (ClickHouse, single-node, c7i.2xlarge, SF50, 1 stream).
Copy the required result files into public/performance/results/<project_id>/:
public/performance/results/<project_id>/

  runs.csv              # Raw query timings (required)
  summary.json          # Aggregated statistics (required)
  config.yaml           # Exact config used (required)
  system_<name>.json    # Hardware details (recommended)
  setup_<name>.json     # Installation steps (recommended)
6.3 Submit a Pull Request
git checkout -b results/<project_id>

git add public/performance/tpch/<config>.yaml
git add public/performance/results/<project_id>/
git commit -m "Add TPC-H results for <system> on <instance>"
git push -u origin results/<project_id>
gh pr create --title "Add TPC-H results for <system> on <instance>"
A maintainer regenerates the leaderboard after merging; you do not need to run benchkit suite publish.
6.4 Example Configuration
project_id: perf_tpch_clickhouse_sn_c7i2xl_sf50

title: 'Combined benchmark: perf_tpch_clickhouse_sn_c7i2xl_sf50'
author: Combined
systems:
- name: clickhouse
  kind: clickhouse
  version: 25.10.2.65
  setup:
    method: preinstalled
workload:
  name: tpch
  scale_factor: 50
  runs_per_query: 5
  warmup_runs: 1
env:
  mode: local
  instance_type: c7i.2xlarge
report:
  output_path: results/perf_tpch_clickhouse_sn_c7i2xl_sf50/reports
  figures_dir: results/perf_tpch_clickhouse_sn_c7i2xl_sf50/figures
The project_id must match the directory name under public/performance/results/. Any legal TPC-H configuration is accepted: different scale factors, different stream counts, different hardware, different tuning. The leaderboard formula handles the normalization.
Live leaderboard: https://exasol.github.io/benchkit/public/performance/
Framework: github.com/exasol/benchkit