

When we think of data analytics in sport, one of the first things to come to mind is measuring physical performance. How much distance did this player cover in a game? How many sprints did they complete and how does this compare to their performance last month? What is not as obvious, is the impact that data can have on tactical aspects of the game.
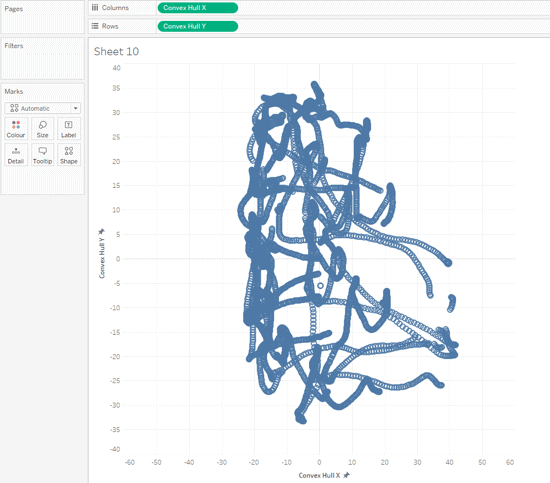
Loading...Data visualization from a tactical viewpoint is equally as important to making a match-winning contribution. One of the most effective methods of making this a reality is to build a Convex Hull. This will make it easy for analysts and coaches alike to see how their team’s tactical discipline, offensively and defensively, evolves throughout a game. Seeing as it is so critical, we’ve developed a step-by-step guide demonstrating how you can get started.
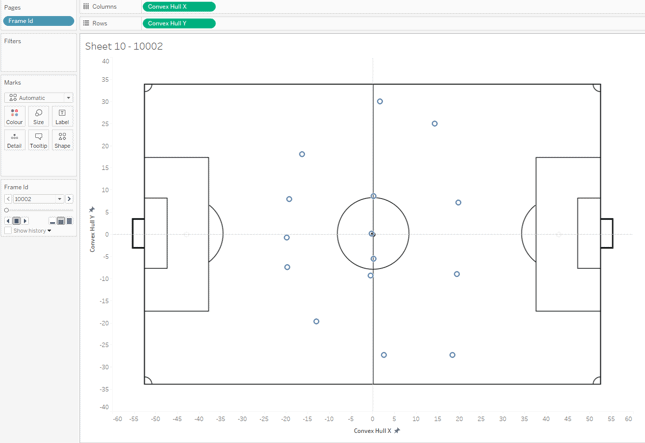
Step 1: Create a scatterplot with a custom background image
- Rows: Place Convex Hull Y on rows
- Columns: Place Convex Hull X on columns
- Under ‘Analysis’ deselect ‘aggregate measures’
- Add Frame ID to the Pages shelf
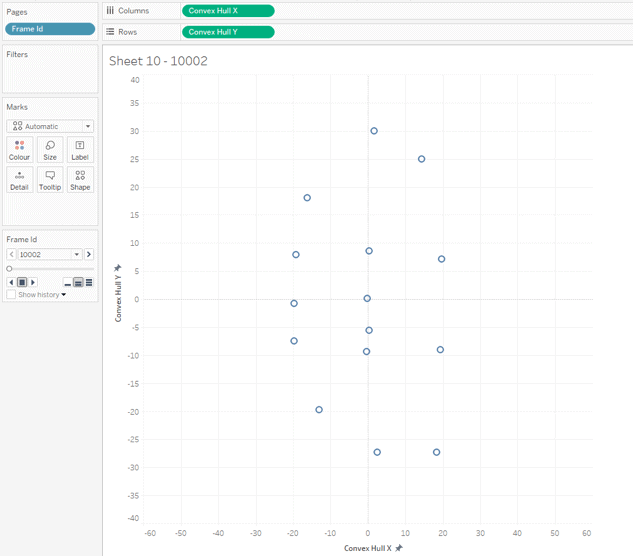
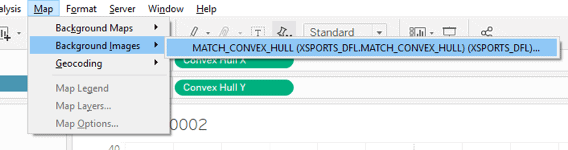
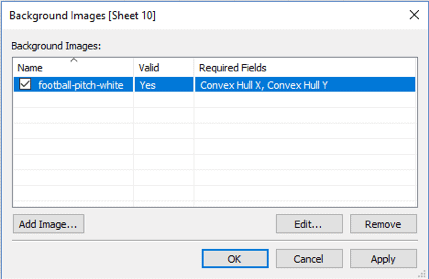
- Add background image
- You will need the outline of a pitch for this
- Use the following specifications for the length and width of the image:
- X Field: Convex Hull X
- Left: -55.5
- Right: 55.5
- Y Field: Convex Hull Y
- Bottom: -34
- Top: 34
- X Field: Convex Hull X
Once you have added the background image, your viz will look like this:
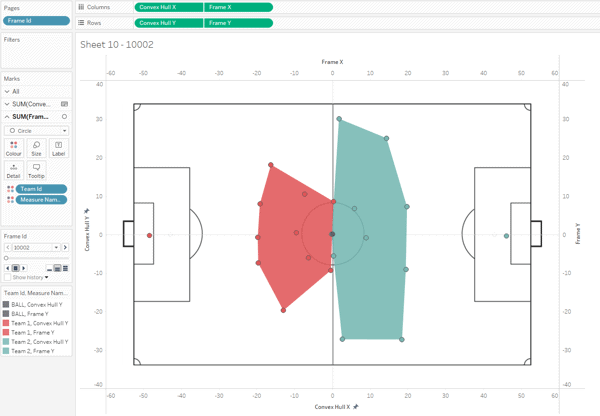
Step 2: Add color for each team
- Color: Add Team ID to color
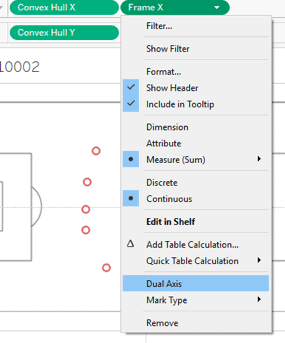
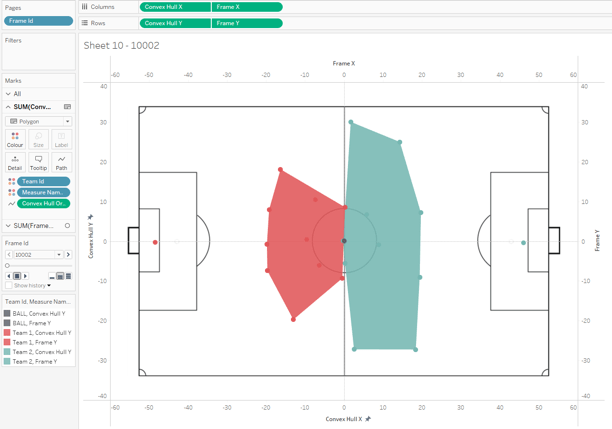
Step 3: Create a dual axis chart
- Rows: Add Frame Y to columns
- Columns: Add Frame X to columns
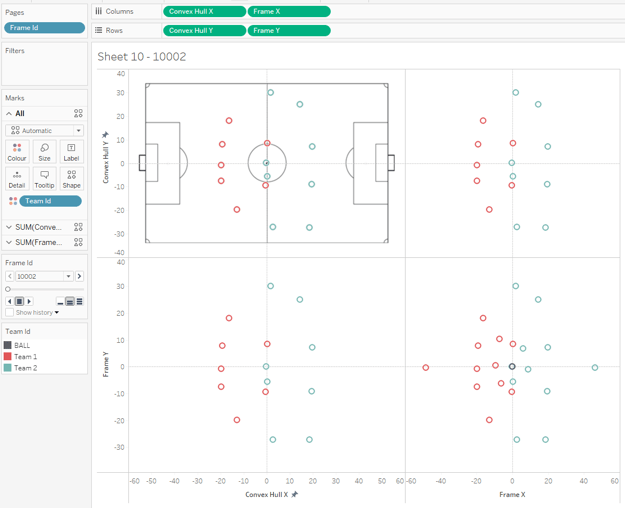
On the fields you have just added, right click and select ‘dual axis’ for both of them.
Your viz now looks like this:
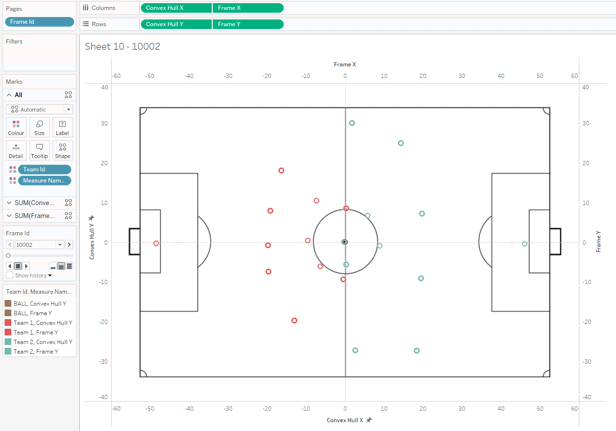
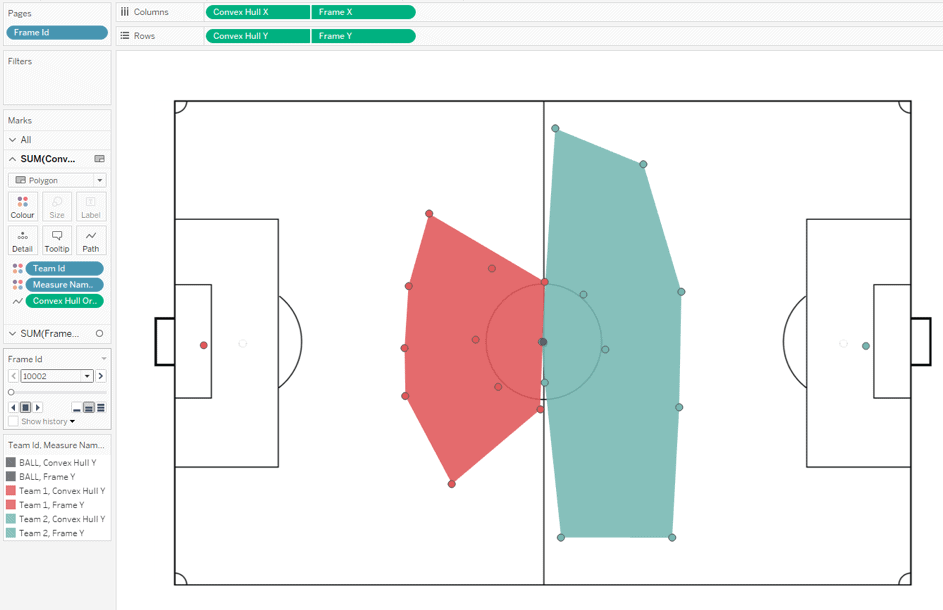
Step 4: Create polygon
- Change convex hull mark type to Polygon
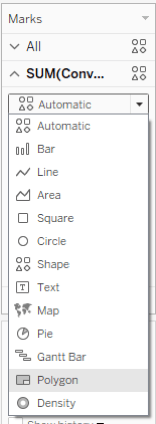
- Put Convex Hull Order onto Path
- Edit opacity (reduce to 65%)
- Change frame mark type to Circles
- Edit the border color and change it to dark grey
Step 5: Any additional formatting
- Remove headers, lines and borders where necessary
That’s what you need to know to get up and running. Do you want to dig into deeper detail about data modelling in our Loading...analytics database and visual analysis? Make sure you read our paper, Controlling Space in Football, here.