

If you’re looking to build a system for sports analytics, think about Exasol’s analytics database. With its great performance and analytical capabilities an Exasol database can easily handle huge volumes of event and tracking data. But as my last blog explained, analyzing historical data is only one part of sports analytics. Live analytics during a match or training helps to support the coaching team in near-real time. The velocity or speed of data processing is crucial for such use cases. Even a time lag of just two minutes could be too slow. Volume and velocity conflict with each other. And this conflict can’t be solved just with technology. You need to add an architectural concept.
The Lambda architecture
Volume and velocity are two defining properties of Loading...Big Data. And Big Data already provides a concept to handle volume and velocity: the Lambda architecture.
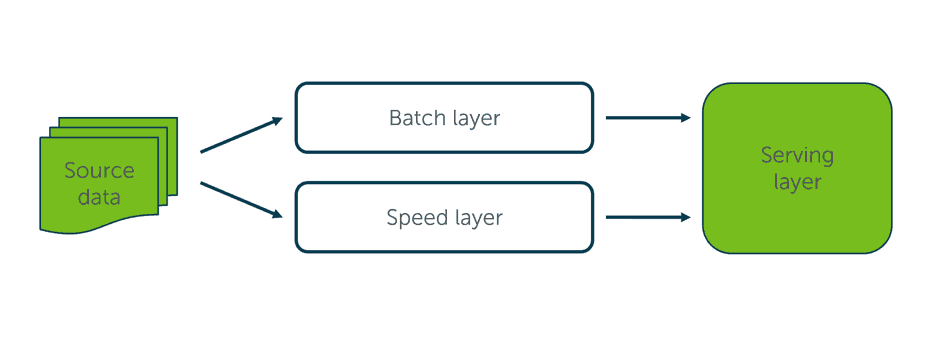
This hybrid approach handles huge amounts of data through batch processing and realizes near-real time processing with the help of streaming technologies. You then access the results in the serving layer. In some illustrations the serving layer is just loaded from the batch layer while the speed layer is queried directly. I prefer the idea of a shared serving layer when it comes to data modeling. That way you’re able to model and combine both batch and real-time data to match the requirements of your visualization tool.
When looking at the technology side, we can find a lots of ETL/ELT and traditional data warehouses in the batch layer. That’s where Exasol’s Loading...analytics database fits perfectly. But how to handle real-time processing? It could be a huge effort for sports clubs to add streaming tools to their technology stack. Apart from time and budget, you also need knowledge and experience. So, let’s interpret the architecture concept slightly differently and use virtualization instead of streaming for the speed layer. Using Opta Sports event data with Exasol and Tableau, we built a showcase for exactly this purpose.
Showcasing real-time sports analytics
Opta Sports and its data feeds are a data source for many sports clubs – not just football ones. They offer statistics for multiple sports and you can choose between a push and a pull service. For this showcase we used the F70 expected goals stream pull service. It allows us to define when we want to load new data.
The combined technology of Exasol and Tableau already proved its worth multiple times, especially in terms of data discovery with huge data volumes. And Exasol’s User Defined Function (UDF) framework allows you to execute Loading...Python and R code inside the database – a key factor when building such a compact analytical architecture.
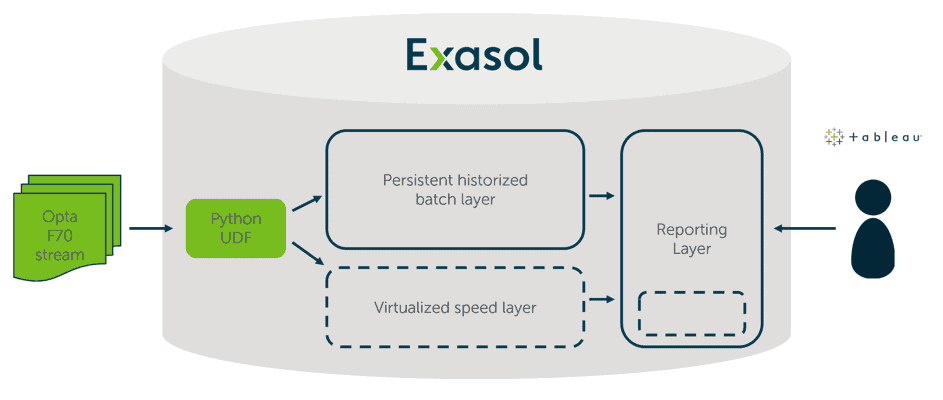
Opta Sports provides their F70 stream in a JSON or XML format. This needs to be transferred first into a table structure. Parsing JSON or XML files can easily be done with Python. That’s why a Python UDF is used to read the source data, parse it and return the data in a table structure.
The batch layer processes the parsed data in a more or less classic data warehouse approach. The source data gets logged and integrated with other data sources. KPI definitions or more complex sport analytical models can be defined and published in the reporting layer. All these processing steps and the corresponding overhead and time lag prevent a near-real time processing.
The virtualized speed layer handles this bit. Defining views on top of the Python UDF offers one main advantage – KPI definitions can still be implemented and provided in the reporting layer. But as soon as you hit the refresh button in Tableau, the Opta data is requested and parsed again.
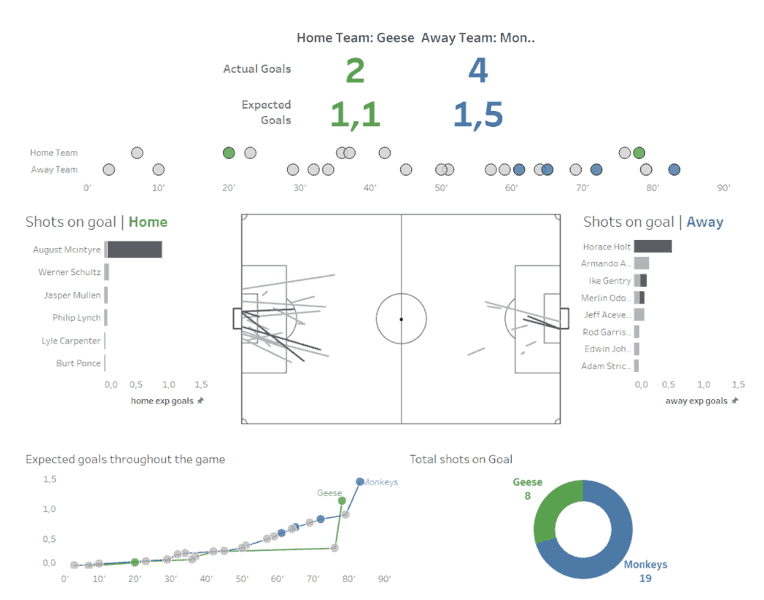
In a proof of concept, we first processed a year’s event and master data with the batch layer. Afterwards, we created a live match report, which uses the speed layer and combines the data of one live match with historic data. The processing took about two seconds. And that’s something you can call ‘near-real time’, I think.
Conclusion
As this concept and the corresponding showcase show, it’s possible to handle the volume and velocity of sports analytics with a compact and straightforward architecture. You don’t need a massive technology stack – the key factor is Exasol’s UDF framework. You can already start your sports analytics journey with the Exasol Community Edition.
This means sports clubs can concentrate on the main business: the actual game – while making it even better with the support of data.